


Here are a few items and thoughts related to “Process Behavior Charts” and my book Measures of Success. Scroll down for some podcasts about the book, as well.
Measures for Measures of Success:
One possible quality metric for a book is reader reviews. The book currently has eight 5-star reviews on Amazon.
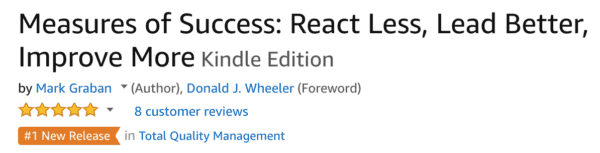
Amazon gives real-time sales data. The book has been the “#1 new release” in the “Total Quality Management” book category. I'm surprised that “TQM” is still the label for such a category on Amazon (that's where you'll find Lean books, Six Sigma books, and various books that seem to be miscategorized).
It's also become the #1 Best Seller in the category, overall:

Amazon annoys me by showing daily sales as a column chart. I really prefer to show “time series data” like this as a run chart or line chart (as I've blogged about here).
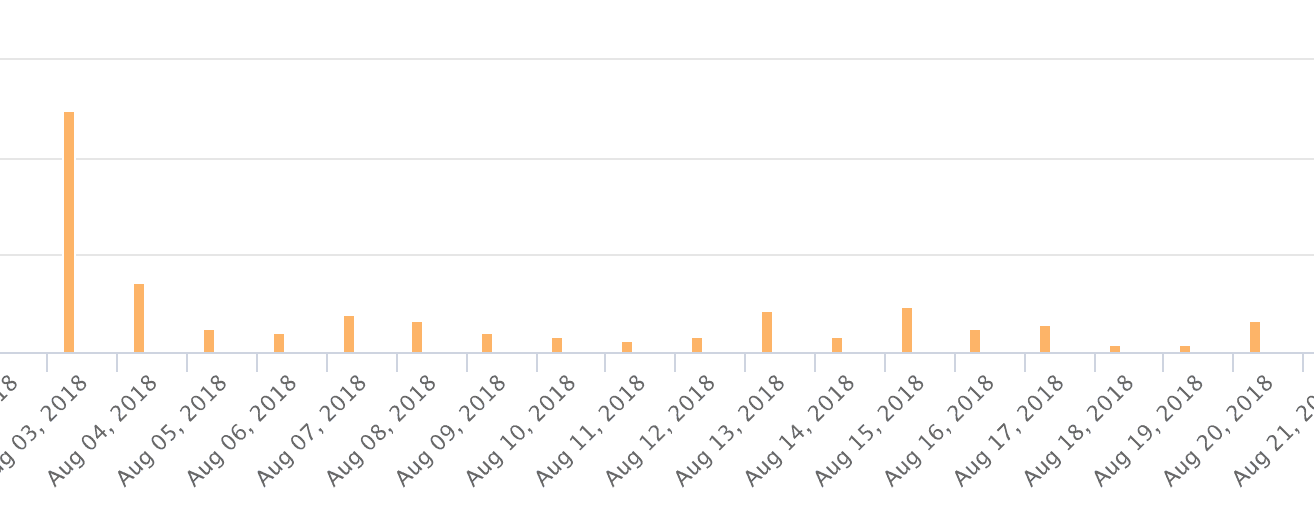
Why is there a big spike on the first day? Those were the accumulated pre-orders that were sold going back to the beginning of June.
I took the data (including the daily pre-order numbers) and, of course, created a Process Behavior Chart that shows sales over time — it's a run chart with the addition of a calculated average and the calculated Lower and Upper Natural Process Limits:
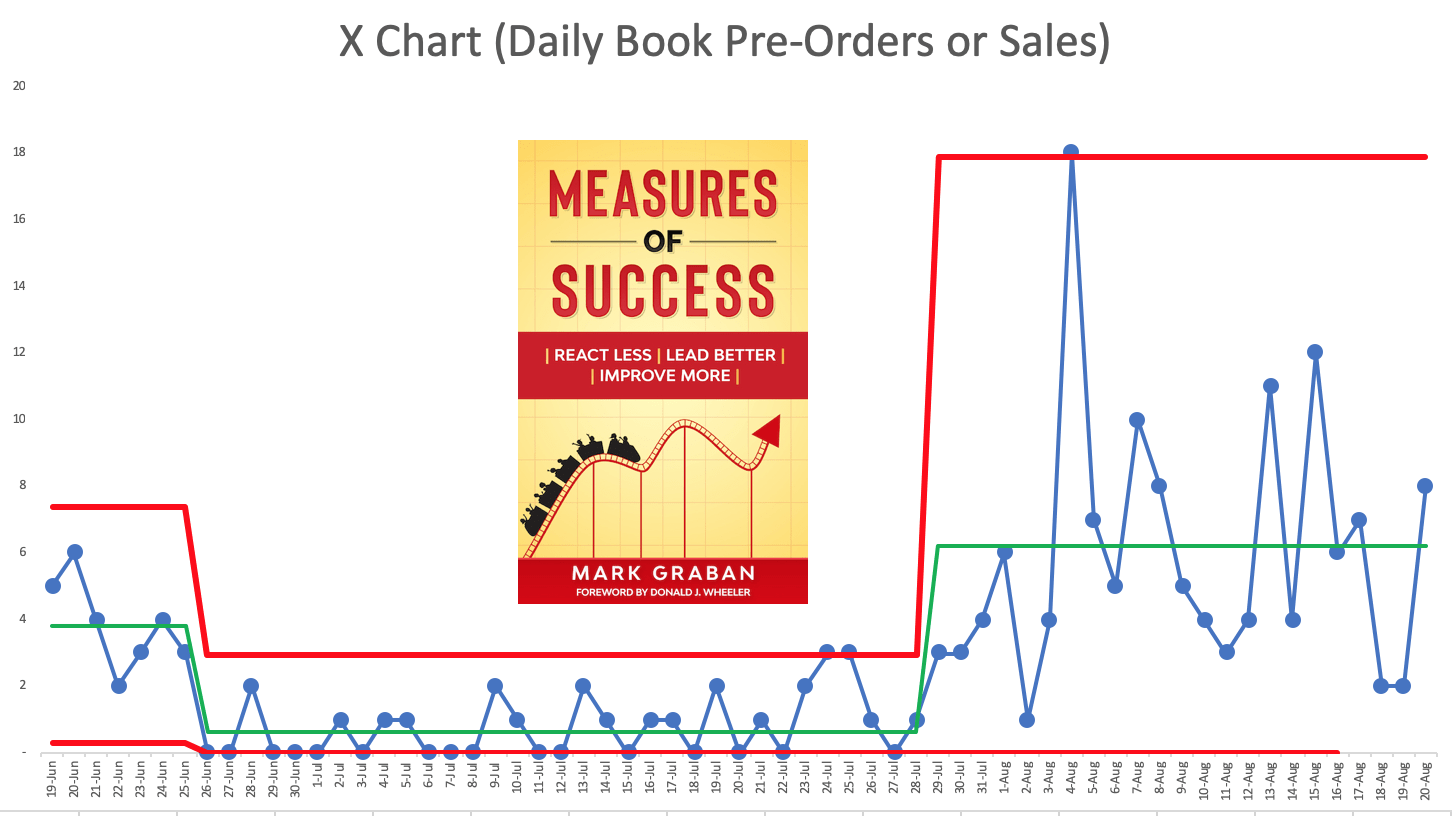
The chart tells me that there have been some “shifts” in sales performance over time.
The first period after initially announcing the pre-order had an average sales of about four per day. It was fluctuating around that average.
Then, there was a lull for about a month, where the average daily sales were less than one. There are more than eight consecutive data points below the old average, which tells me there was a shift in performance.
Then, we see another jump up that happened in August. With more than eight consecutive data points above the average, that's evidence of another “signal” that says the system has changed.
The big spike on August 4th corresponds with the official launch on Amazon and social media mentions that I made. That would probably explain the signal of that data point that's just above the Upper Natural Process Limit.
Going forward, I can predict that the book will sell an average of six copies a day and that daily sales will fall between zero and 18 — unless something changes again in the system.
Promotional activities like a guest post for LEI or a webinar for Catalysis didn't appear to lead to an immediate or significant spike in sales. But that's fine.
This methodology helps me avoid overreacting to every up and down in the sales data. There's variation in every metric. Process Behavior Charts have taught me to think about AVERAGE performance, fluctuations around that average, and sustained shifts in performance, not just blips.
Update
I found another signal! I found a day with sales above the upper natural process limit. And, then the next day was even higher. I don't know yet if this is a “blip” or the beginning of a “shift” where sales will now fluctuate around a higher average.
I used this example in a webinar I did for Lean Frontiers…

I don't know yet what changed… hopefully that will become clear at some point. Book sales is a more complex system… I can't go out to the workplace “gemba” to physically look at the process that drives sales.
How can you use charts like this in your workplace? For sales data? I'd love to see your examples.
Sales Data and Pricing
I also took a look at sales data for my book at Leanpub.com, where I started selling the “in-progress” version of the book in April when it was just three chapters at that point (and you can still buy it there in PDF, Kindle, and EPUB formats, along with special “digital extra” downloads).
One cool thing about Leanpub is the ability for buyers to choose their price. I get to set a “suggested” price and a “minimum.” Buyers can drag the slider or enter a price in the box… and it shows them what I get (80%) as an author.
Over time, I've adjusted the minimum and suggested price. Early buyers got a discount for taking a chance on a book that wasn't yet completed. I've raised the price and have experimented a bit with the pricing.
I'm sharing a higher “suggested” price compared to Kindle and Apple because readers can get a PDF, which is a very flexible format for reading or printing. There are also “digital extras” that are downloaded with the book. Much of this material is on my book's website, but there's a convenience of getting those as part of the purchase. And, I'm offering 30 minutes of free virtual coaching to people who buy the book there. The minimum price, for those who choose it, is lower than Kindle and Apple.
It's interesting to see that some buyers have chosen to pay MORE than the suggestion — two people have paid $30 (as circled in purple, below). Here is a scatterplot that shows the prices paid by readers over time:
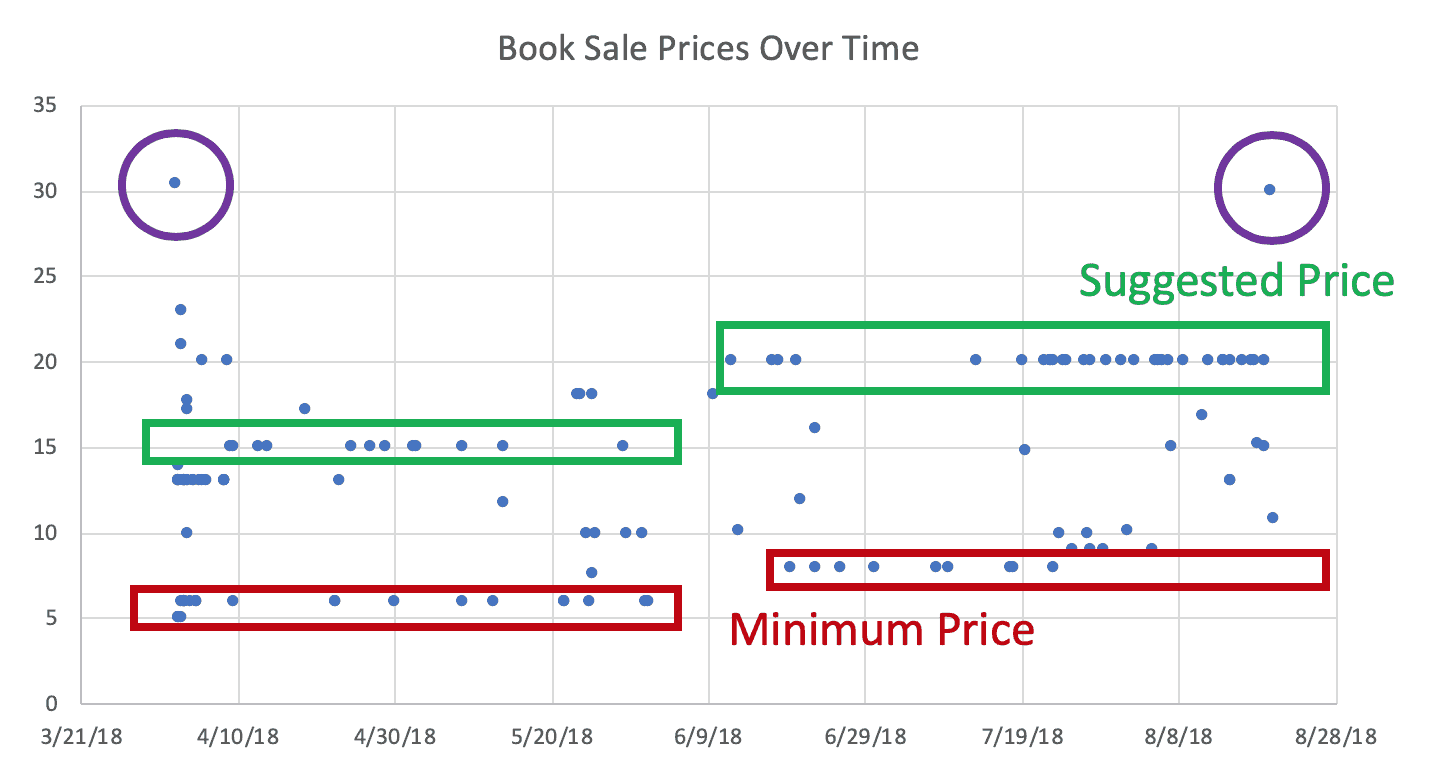
Recently, a majority of people have chosen the suggested price, which is intersting to see. Thanks to those who have chosen to pay more :-)
Updating a LinkedIn Article
I went and gave a slight refresh to an article that I published on LinkedIn last year:
“Your “Lean Daily Management” Approach Would Be Even Better with Some Simple Statistical Methods“
I also recorded a video that walks through the post:
Talking About the Book in Two Podcasts
I was invited to be a guest on a podcast called Venturi's Voice to talk about the book.

You can listen to the podcast there and the video is a short segment about “failing fast” (and hopefully learning and improving as a result). You can also find them in Apple Podcasts and other podcast sources.
I was also a guest on the Leanpub “Frontmatter” podcast, which you can listen to here:

They've also posted a full transcript if you'd rather read.
Leanpub is one of the places where you can buy my book.
Thanks for checking this out.


