

Two Data Points Are Not a Trend: People Quitting Jobs
I've been doing some radio interviews recently (as I blogged about here and here). The firm that helps line these up is very good at connecting topics I'd like to talk about, the “My Favorite Mistake” podcast and data-related topics from my most recent book, Measures of Success.
I've done a few interviews about this news story:
“A record number of Americans are quitting their jobs”
Now, we don't always get into all of this detail on the radio, but I can share more points and use some illustrations here.
When I see phrases in headlines like “record number” or “highest in X years,” it makes me curious. The next question I ask is, “Well, is that data point statistically meaningful? Is it a statistical outlier?” Instead of “outlier,” we might say “signal” if we're looking at the data through the lens of Statistical Process Control or, more specifically, Process Behavior Charts.
“Record number” is a factual statement. It's true. But is it meaningful?
“A record 4.3 million people quit their jobs in August…”
Again, fact. But that's the context?? What decisions would we make, being armed with that information?
Another factual statement:
“About 2.9% of the workforce quit in August, up from 2.7% in July…”
We always have to be careful about two-data-point comparisons. Sometimes the change is meaningful and sometimes it's not.
Is the data point, or the change in data points, a “signal” or is it statistical “noise” in the metric over time? Is the data trending upward over time? Or is it just fluctuating around an average and this just happens to be the record peak?
We need to look at more than two data points and we need to visualize the data over time, or #PlotTheDots as my friends in the NHS England say.
Another two-data-point comparison in the story:
The number of workers who quit rose by 242,000 from July…
FACT. But, again, is that meaningful?
Here's the audio of me on The Laura Coates Show (SiriusXM Channel 124 POTUS):
Read a transcript of the interview
This is all U.S. federal government data, so we can find it online. Let's put aside any discussion about how accurate the data is. I don't know the answer to that. As it says here, these are estimates. But if their methodology is consistent over time, we can compare months and years. There is probably some “measurement error” that might be consistent (or may vary), but that's part of the “noise” that might be in the data.
The Bureau of Labor Statistics Job Openings and Labor Turnover Survey (JOLTS) program publishes estimates on job openings, hires, and separations. JOLTS estimates can provide greater insights into labor market dynamics, such as labor demand and labor turnover, than other employment measures.
You can download data and you can also generate charts directly on the website. Before I realized they would generate a “run chart” (aka “line chart” in Microsoft Excel), I created my own with the data. The number of “quits” is plotted, with quits being defined as:
Quits: Employees who left voluntarily. Exception: retirements or transfers to other locations are reported with Other Separations.
Note, “quit” doesn't mean they left the workforce. This data goes back to 2011, for US non-farm jobs.
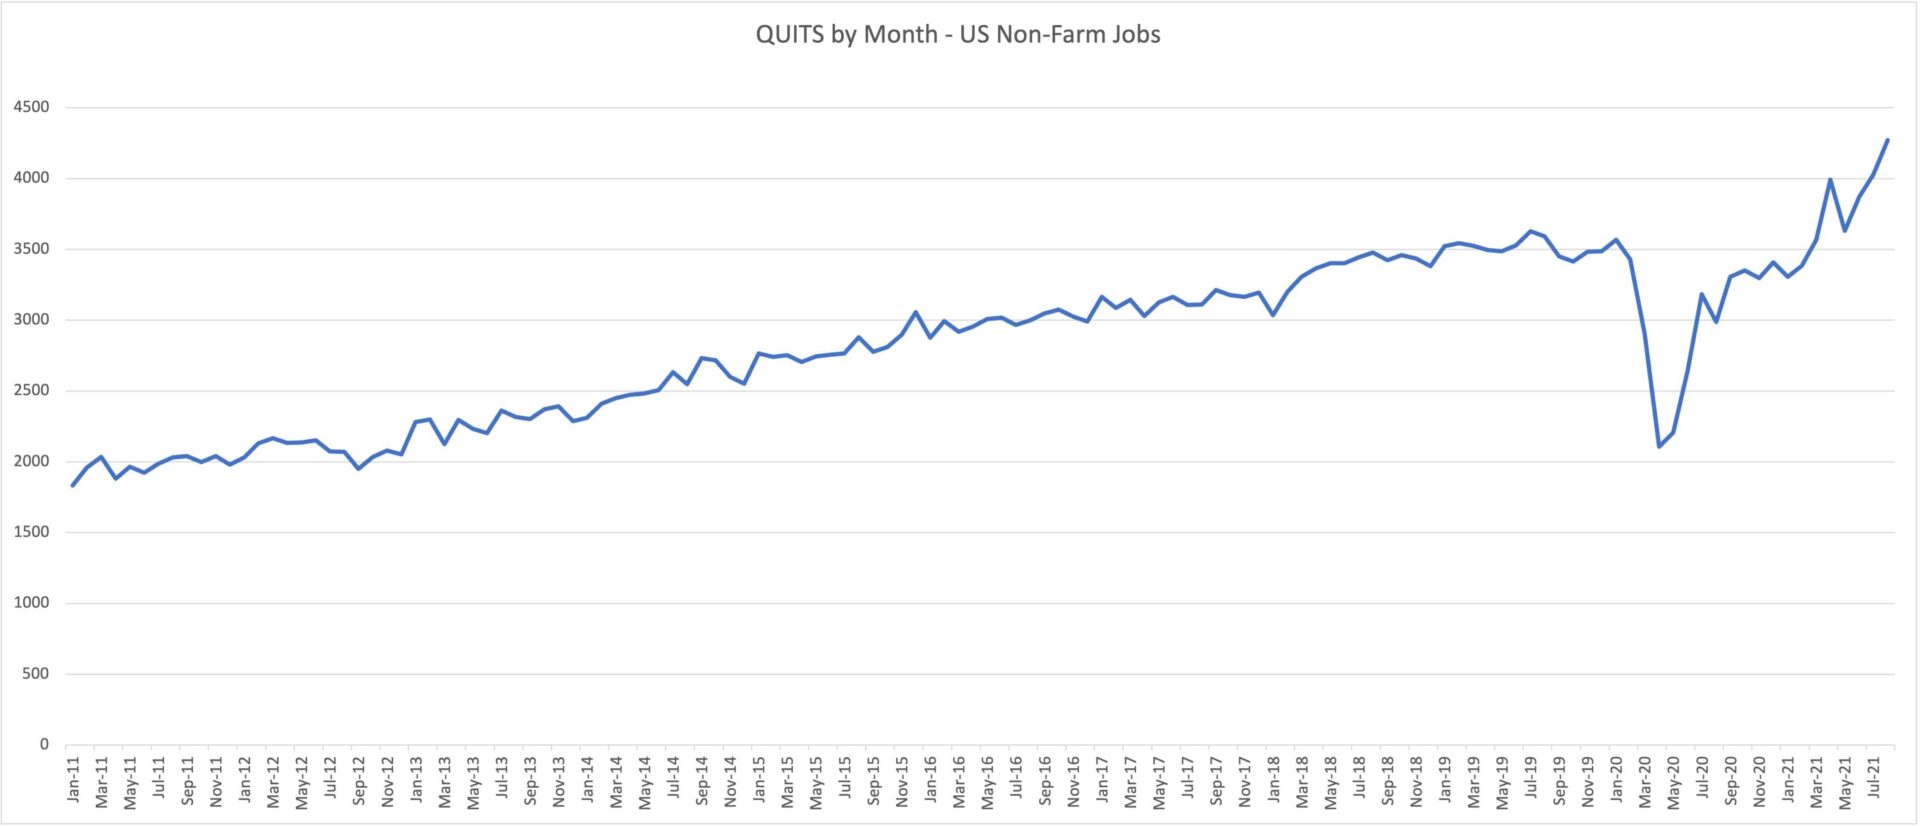
So, yes, that last data point is the highest ever. But, the run chart CLEARLY shows a fact that is not present in the news stories. We could state it as:
- The number of people quitting their jobs has increased steadily since 2011.
- The exception to this is when it dropped a large amoung in March and April 2020 (COVID)
- The data is basically right back to where it would be if the earlier trend had just continued (if there had been no pandemic)
Here is the chart with a linear trend line generated by using ALL data points:
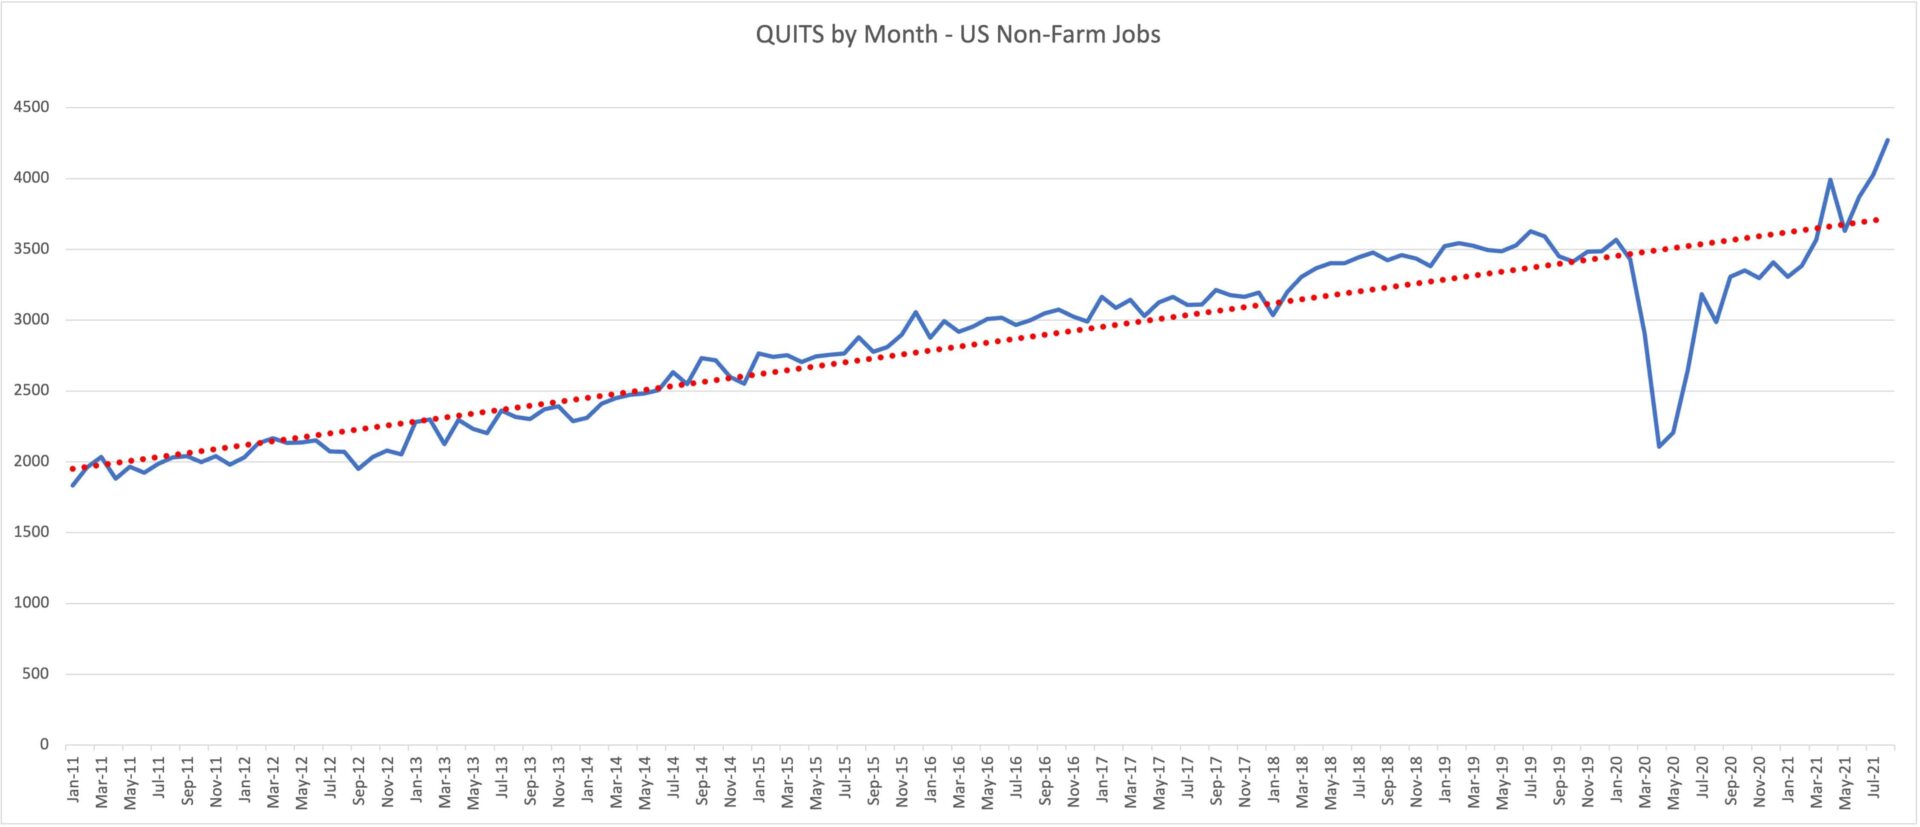
So, rather than blaming Covid for the increase… or blaming whatever short-term factor, maybe we should ask questions about the longer-term trend.
Do we see headlines that say:
“The Number of Americans Quitting Their Jobs Each Month Has Doubled Since 2011”
Why is that? The answers to THAT question are probably different and might be more meaningful than the attempts to explain every up and down in the metric.
Here is the chart that's generated by the government website that goes back to 2001.
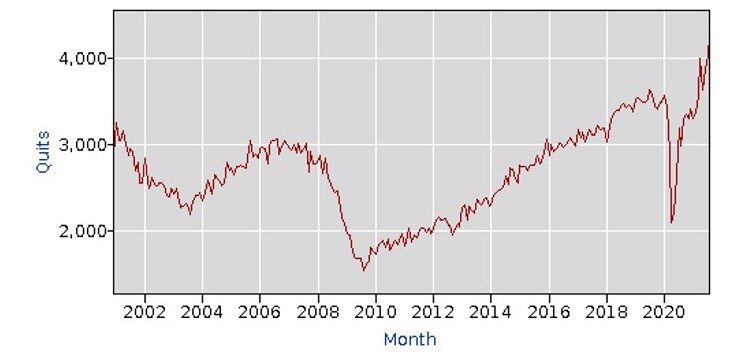
Look at what we see there:
- The numbers formed a cyclical sine wave type pattern for about eight years
- Then there was a huge drop with the Great Recession
- It looked like it was going back to oscillation, but we had pretty sustained linear increase for a decade without significant drops
What should businesses or policy makers do with this information? Well, they might make better decisions — less reactive decisions — if they looked at longer trends instead of a data point or two.
The data are facts. Some facts are meaningful and create knowledge. Ascribing causes might be a matter of guessing. Charts don't tell us WHY the numbers changed — that's up to experts, deeper analysis, or educated guesses.
Does that increased trend in quitting jobs correlate with data around the number of new businesses being started? Is this because it's generally now CHEAPER to start a business than it used to be?
Here's data on new business starts (the number of businesses less than one year old) — tip: be careful with the Y axis, as it doesn't start at zero.
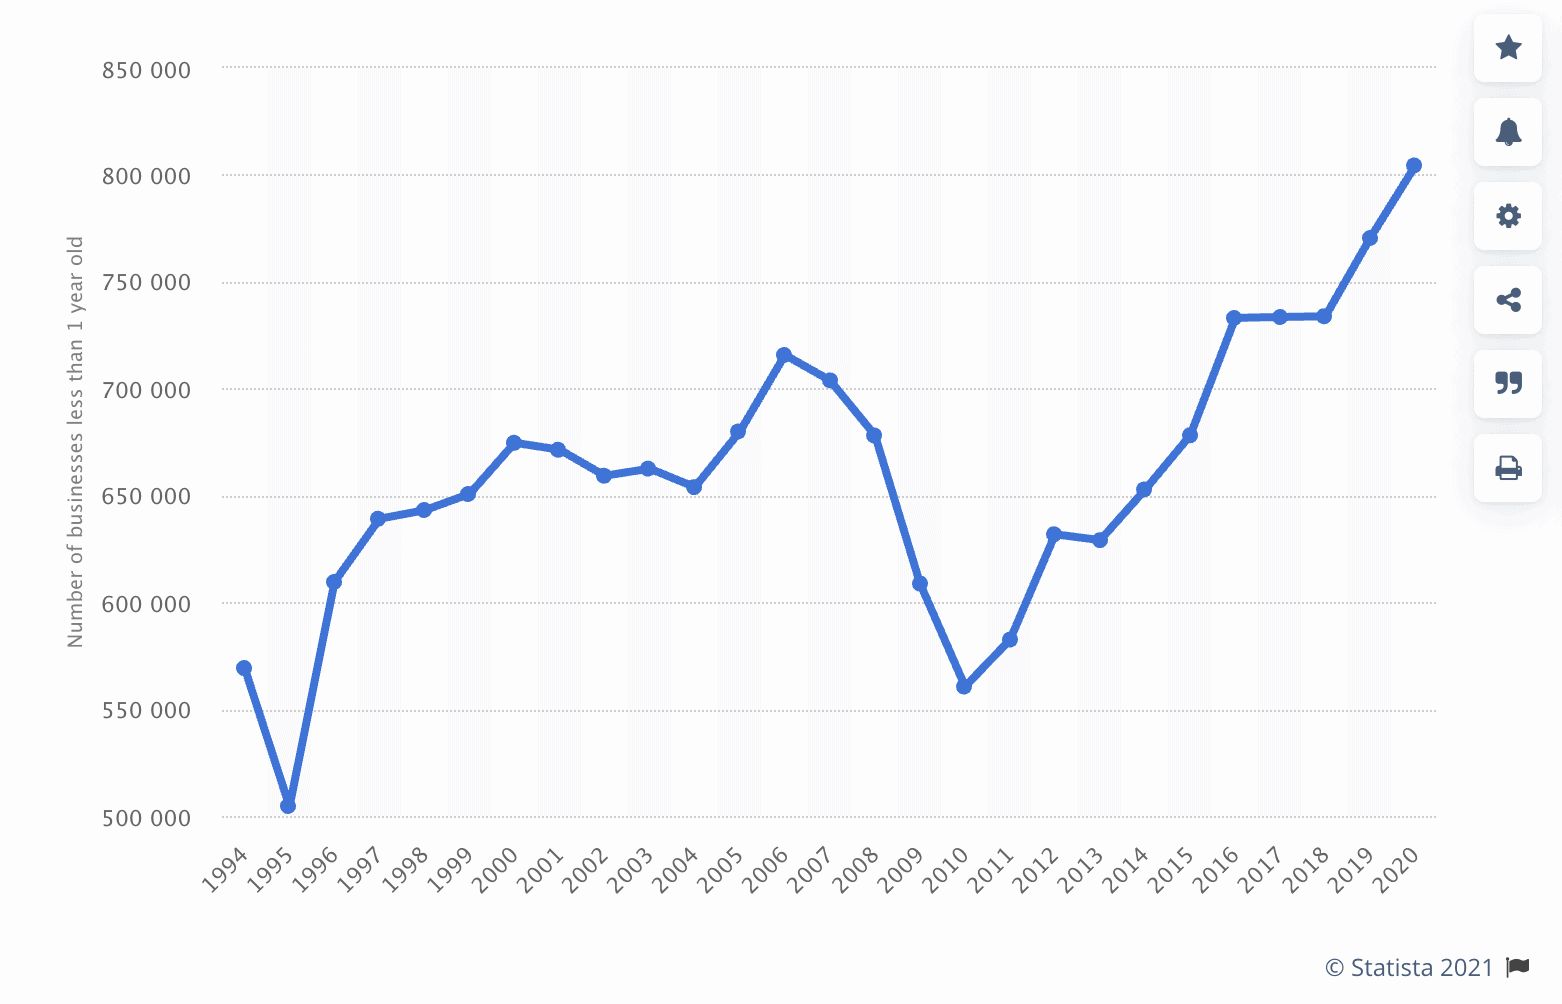
Look at that steady increase in new business starting in 2010. Reasonable hypothesis that more people are quitting jobs to start new businesses, even if most quit to take other jobs?
Surveys About Quitting
These are interesting numbers that I pulled together from different studies that you can find online, from PWC and others:
- 25% HAVE quit their job this year so far – 22% quit their job in 2019
- 65% say they're LOOKING for a new job
- 95% say they are THINKING of quitting — burnout is #1 reason, lack of growth #2
Two thirds think “a good opportunity” is available for them if they quit.
The most likely groups to quit, according to a study:=
- Age 40 to 45
- 5 to 15 years tenure
- Women
Somebody can, of course, fall into all groups… as did my wife when she quit job last year to take new one.
Different surveys list every imaginable reason for why people change jobs. It's not always about money…
My Favorite Mistake Guests Who Have Talked About Quitting Jobs
There's the mistake of quitting, the mistake of taking the wrong new job, and the mistake of NOT quitting when it's a really toxic or abusive environment.
These episodes of My Favorite Mistake include:
Ean Price Murphy quit a job that wasn't a passion (teaching), and found a new passion in bookkeeping, starting a company called Moxie
John Paragon (UK) quit a job selling cars to start a company and found himself in the “pit of despair” – deep depression after starting a company, but things got better
AmyJo Mattheis stayed in a role as a pastor too long and regretting not making a move sooner – she knew it was time to go, but didn't. She stubbornly thought she could fix the situation.
Eric Twiggs thought his new job (video store district manager) was a mistake on Day 1 (people working there needed too much handholding) and he almost quit… was that a mistake? He stuck with it, and it worked out OK. These things aren't always clear in the moment. Left previously job because he wasn't fulfilled
Therapist and a chiropractor who both shut down their businesses to take a job and they both regretted it – went back to their own biz a 2nd time, but did better
Lori Baker-Schena had two bosses who didn't get along… and she stuck with it too long
Brian Buck stayed with a job too long after it turned toxic
Gena Cox left a job in a “cavalier” way and regretted it
Please subscribe…


I remember when I worked for an organization and the Regional Managers would twist themselves in knots trying to explain “statistical noise” as if their actions had anything to do with it. It was particularly difficult for the smaller regions, where one lingering case that got resolved would totally throw off their numbers, and instead of being celebrated for finally figuring out how to resolve the situation, they’d be lambasted for the drastic drop in performance. From a stats perspective, they’d have been better to have the case linger on until after they left the position, a result that wouldn’t have been in the interest of either the client or the organization. Thanks, Mark
Thanks for reading and thanks for commenting, Hugh. Yeah, it’s not a good use of time to overreact to noise in a metric. Dealing with smaller sample sizes can make it more difficult to connect cause and effect since that might make the metric “noisier” than others.
I remember a Deming quote, “The most important things are unknown and unknowable.” Do you think that factors in here?
Good question. What are the reasons for people quitting? The chart won’t tell us the reasons why. We need to study and understand the system… the broader reason for the trend could be knowable or discoverable perhaps. I don’t know what it is and won’t pretend to know. Would surveys provide insights?
A new data point — another new record high.
A record 4.4 million Americans quit their jobs in September as labor market tumult continued