


Rodger Sherman is a fellow Northwestern alumnus who I follow on Twitter, for tweets about NU football and beyond.
He recently tweeted about NFL field goal percentages, including two helpful line charts (a.k.a. “run charts”):
Does a statement like “the worst level in 16 years” mean that it's a statistically meaningful decline? Not necessarily.
He wrote more about this:
“What's Behind the NFL's Kicking Regression?”
Again, I'd ask “IS there a regression” or significant decline?
Rodger's subheadline reads:
“Nearly every year, the league's kickers get better–but in 2019, field goal accuracy is down 5 percentage points. What happened?”
Is “down 5 percentage points” a meaningful decline that's worth explaining?
A “Process Behavior Chart” can help answer that question, as I've written about in my book Measures of Success.
I took Rodger's chart that showed 2004 through this partial season and turned into a PBC (thanks to data from Pro-Football-Reference.com).
I used all of the years (2004-2019) to calculate the average and the limits (learn more about the calculations here or in my book). What does the “X Chart” tell us?
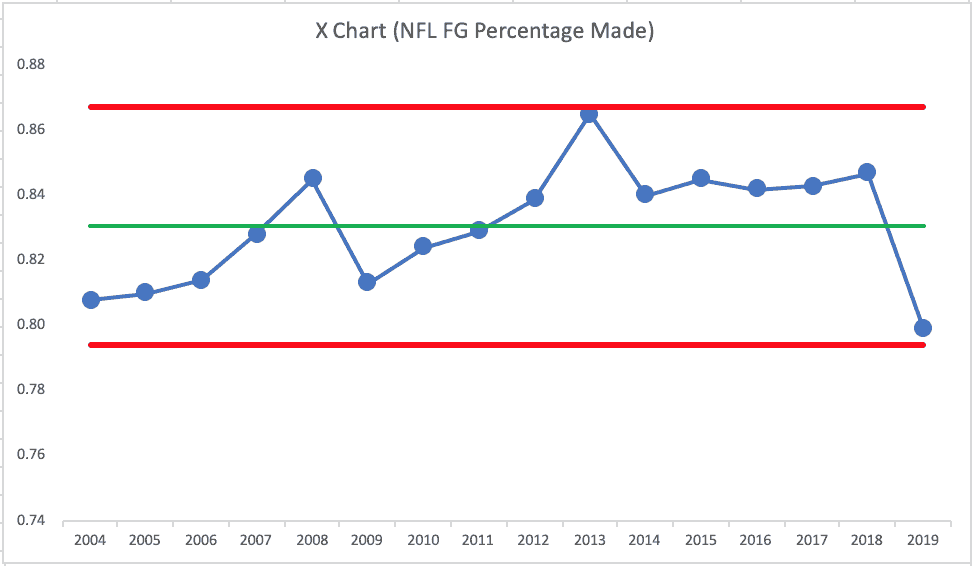
We see that 2013 was almost a “signal” as that data point was just below the Upper Limit. The last seven seasons were all above average… which is one data point of a “signal” — had 2019 also been above average, that would mean there was a meaningful shift upward. But, 2019 is pretty close to the Lower Limit. In and of itself, that 2019 data point is not a signal per the X Chart. Again, those three rules for finding a signal are:
But, a complete Process Behavior Chart includes the companion to the X Chart — that companion is the “MR Chart” where we plot the “Moving Ranges” (the absolute value of the difference between each two consecutive data points). We also calculate an “Upper Range Limit” and we use Rule 1 to look for a signal in the MR Chart. This is shown below:
The 2019 Moving Range *is* a signal, as it's a bit above the Upper Range Limit. This tells us that the year-to-year DECREASE in field goal percentage is unusual. It's a signal that's worth explaining.
If we only created the X Chart, that huge decrease is perhaps visible — it stands out as looking unusual, but the MR Chart (and the math behind the Upper Range Limit) confirm that it's unusual variation (you might want to scroll back up and look at the X Chart again).
We don't want to waste time explaining “noise” in a metric. It's noise when we have no signals in the chart.
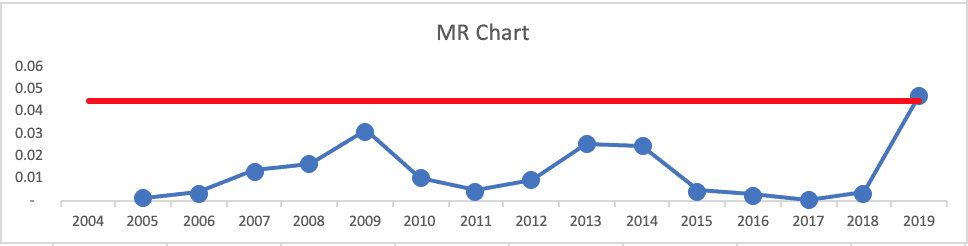
A PBC going back to 1993 shows more context… it's not a single “predictable system” over this timeframe. There are reasons for shifts upward in field goal accuracy:
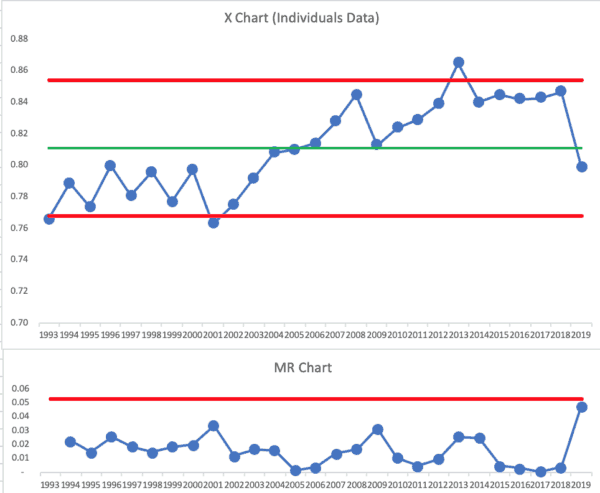
From this longer-term view, I'd probably recalculate a new average and new limits starting in 2006 when we have the first of a long run of above-average data points. Why did field goal accuracy improve in 2004 or 2006?
Here's that longer time frame showing a shift in the metric:
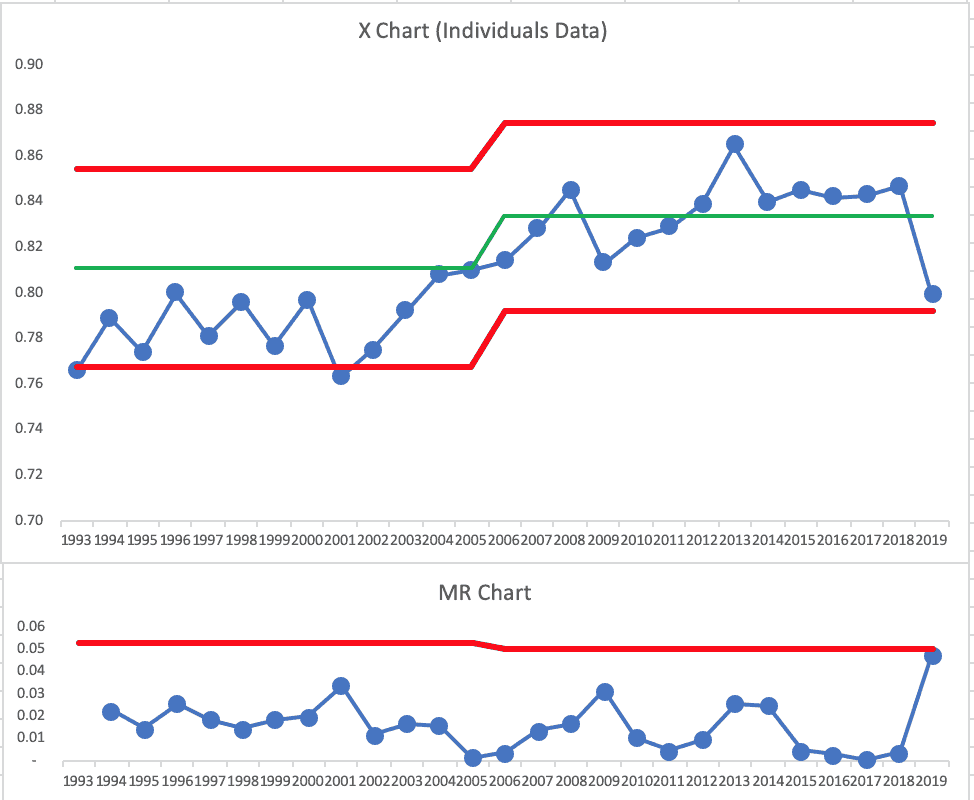
Is 2019 a signal? It's close on both the X Chart and the MR Chart.
What does Rodger write about as possible causes?
First off, he gives a bit more context in words:
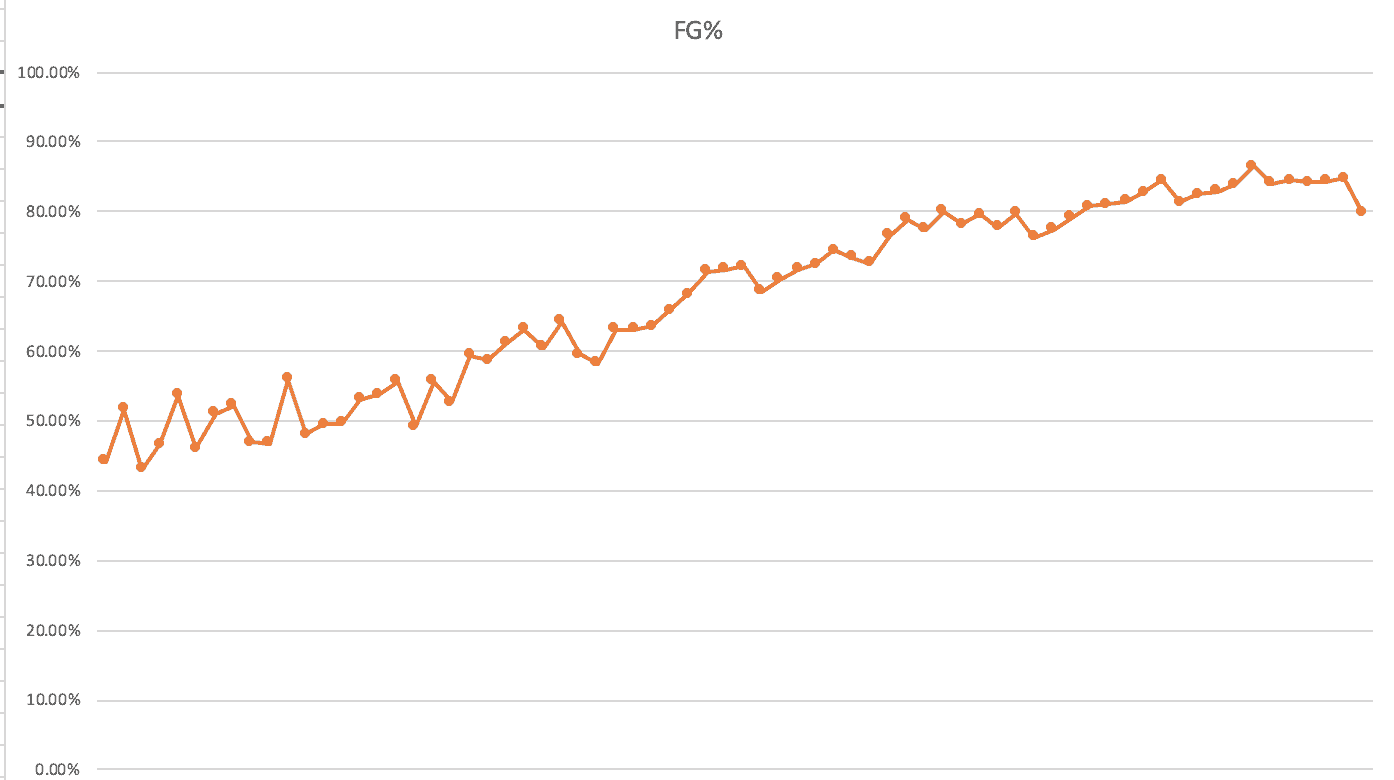
But for most of football history, kickers have steadily become less sucky. In 1950, kickers hit 44.2 percent of their field goals. In 1960, kickers hit 56.0 percent of their field goals. In 1970, it was 59.4 percent; in 1980, it was 63.6 percent; in 1990, it was 74.4 percent; in 2000, it was 79.7 percent. Last year, it was 84.7 percent. It was the second-most-accurate year in league history (2013, when kickers made 86.5 percent of their kicks, holds the record).
A run chart is very helpful, from the 1950s through today, as a picture is worth a thousand words, or so:
Given the general upward trend, it might be a bit of an overreaction to worry too much about this season.
Rodger's conclusion is about the same as what I would think:
“I suspect the drop-off is a blip, not a trend. The decadeslong upward trajectory of kickers is too strong to suddenly be derailed this violently.”
Is the ball different this year? The NFL does use a different, special ball for kicking, the “K ball.”
Teams are attempting more long field goals… but the percentage made on those longer kicks has fallen this year:
“From 2010 to 2018, kickers hit 72.8 percent of these kicks [longer than 40 years]; this year it's 63.7 percent.”
But, again, is that also just a blip? The NFL stats don't show annual numbers for “percentage made beyond 40 yards.”
As with any metric, it will be interesting to see what 2020 brings us…
Please scroll down (or click) to post a comment. Connect with me on LinkedIn.
Let’s work together to build a culture of continuous improvement and psychological safety. If you're a leader looking to create lasting change—not just projects—I help organizations:
- Engage people at all levels in sustainable improvement
- Shift from fear of mistakes to learning from them
- Apply Lean thinking in practical, people-centered ways
Interested in coaching or a keynote talk? Let’s start a conversation.


Great article. I’ll point out if that “almost signal” happened in 2014 it would almost certainly be attributed to the goal posts being extended. That was my first thought before checking. A good example of how we love stories so much we will incorrectly shoehorn data into them.
Discussion on LinkedIn:
Mark, more granular data on Field Goal Accuracy is available at:
https://www.pro-football-reference.com/years/NFL/kicking.htm
Ah, thanks — I hadn’t scrolled down enough to see the more granular stats… the real numbers for 40+ FGs, not just the rounded off “per game” numbers.
The percentage of 40-49 yard field goals made has been up and down… this year seems like a near-signal decline compared to recent years. Notice also how variation was significantly lower in that middle stretch.