


Thanks to Ron Pereira and the team at Gemba Academy for having me as a guest for the sixth time on their Gemba Academy Podcast (find past episodes via Google). Here is a direct MP3 link to the episode, click below, or see the embedded Stitcher player below that:
GA 250 | Using Process Behavior Charts with Mark Graban
I appreciate having the opportunity to talk about “Process Behavior Charts” and my book Measures of Success: React Less, Lead Better, Improve More.
Hopefully, the exposure leads to some increased book sales. How would I know if the daily or weekly sales number is just fluctuating (“noise”) or if there's a meaningful “signal” that shows the podcast might have increased sales significantly (and/or sustainably).
Here is a Process Behavior Chart of recent daily book sales. The number fluctuates around an average of about 2.3. The calculated Upper Natural Process Limit is just under seven. There are no “signals” in the chart — it's all “noise.”
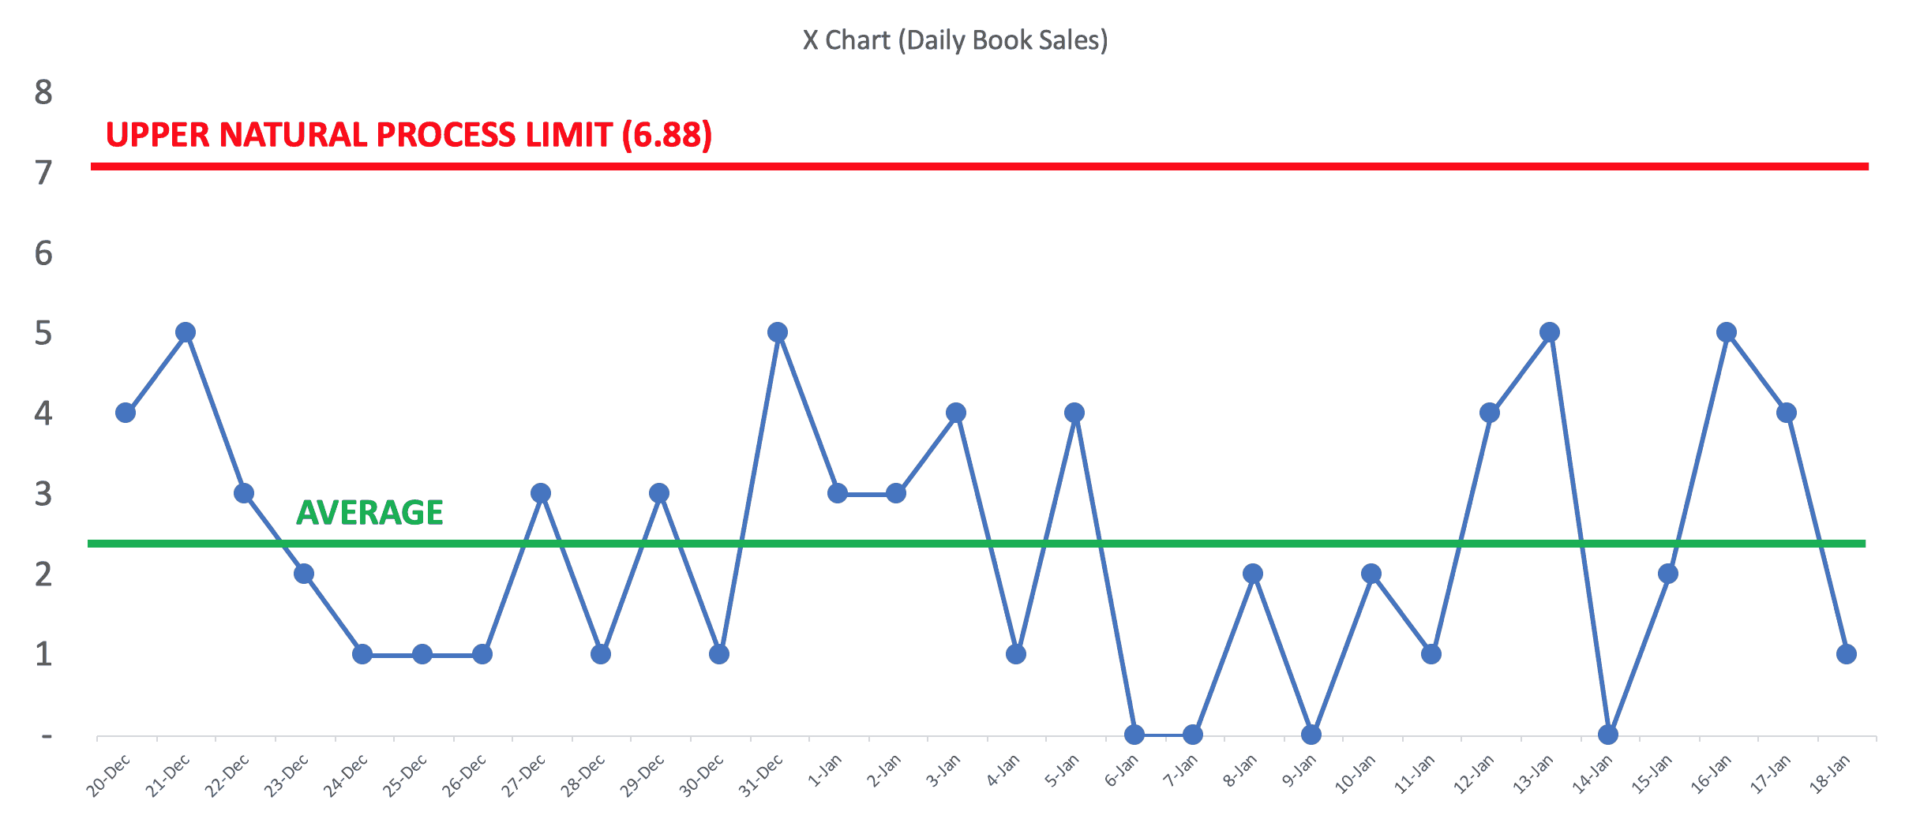
This chart tells me that I could expect that future sales will fall between zero and seven per day. I'd expect to see the number fluctuate around the average. I'll get some streaks above the average and some below. That happens naturally.
A predictable system tends to stay predictable unless something changes significantly in the “system” that drives book sales. The upcoming release of the paperback version might be such a change that creates a shift in the average. Or maybe that podcast has the effect. We'll see.
The next days' sales were: 2, 3, 1, 1. The prediction of the Process Behavior Chart held true through yesterday.
Instead of reacting to each day, I can work to improve the system.
I often get asked, “When do we adjust the Natural Process Limits on a Process Behavior Chart?” We might adjust the limits when there is a good shift in the metric — when the average is better. We'd generally detect a sustainable shift when we see eight consecutive data points that are better than the average level of performance.
I'll share some other data and write more about “shifts” that would lead me to adjust the limits in a future blog post.


