RAG Charts Aren’t Real Visual Management: How Process Behavior Charts Improve Decisions
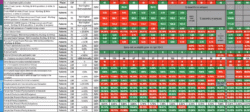
tl;dr: RAG and bowling charts trigger overreaction and hide real system behavior. Process Behavior Charts reveal whether performance is truly changing, helping leaders focus on causes instead of colors and make better improvement decisions. In my book Measures of Success: React Less, Lead Better, Improve More, I argue that “Process Behavior Charts” are a better technology than tables of color-coded numbers. These tables of numbers are often referred to as “bowling charts” or “bowlers.” They … Continue reading RAG Charts Aren’t Real Visual Management: How Process Behavior Charts Improve Decisions
3 Comments