

As next week's Lean Startup Week approaches, I'm pretty laser focused on preparation for my:
- Facilitation of the famed Deming Red Bead Experiment
- My keynote talk on learning to distinguish between signal and noise in metrics
Eric Ries, author of The Startup Way and the founder of this event, cited Dr. W. Edwards Deming multiple times in his first book The Lean Startup. Hear my recent podcast with Eric.
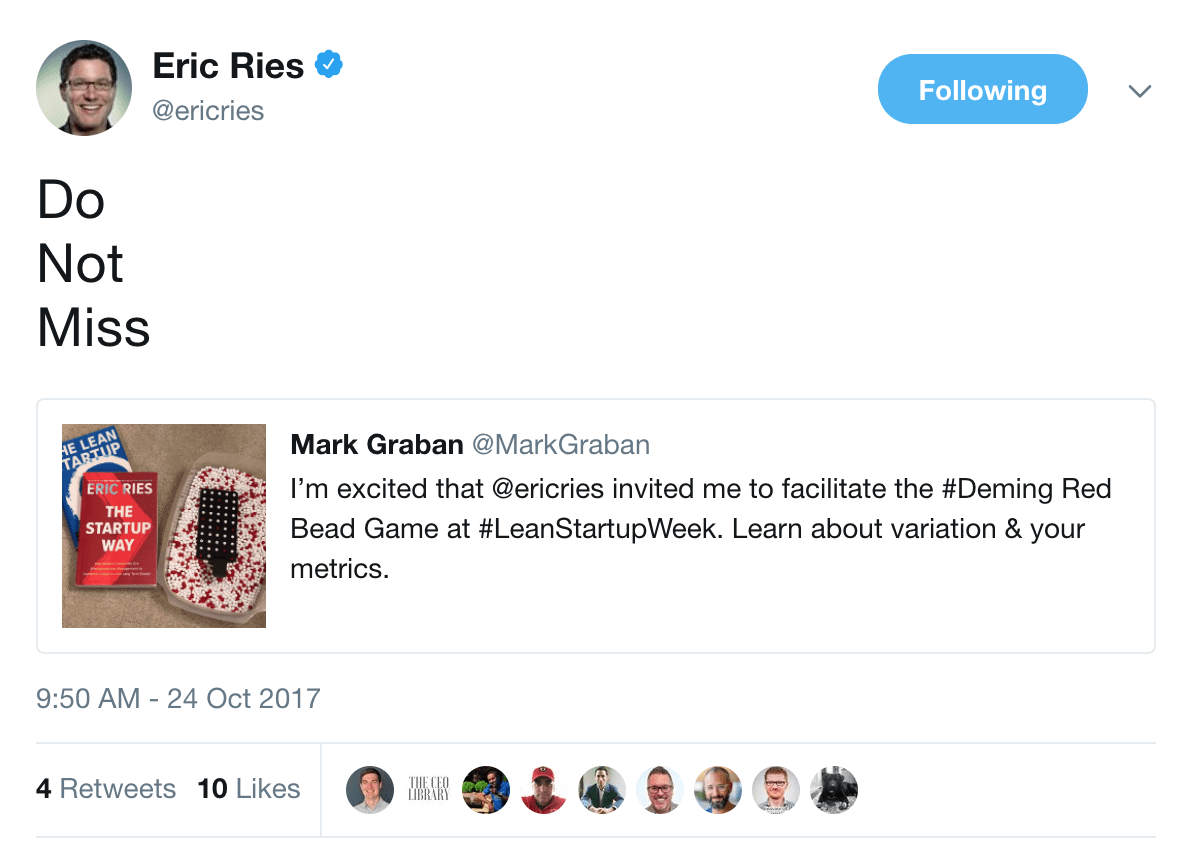
I was excited when Eric took me up on my offer to bring the Red Bead Experiment to the event as a lunch-and-learn… he seems excited about it too:
In my keynote talk that helps set the stage for the Red Bead exercise, my main theme is:
Leaders (in startups or any organization) would do better if they'd stop wasting time overreacting to every up and down in performance metrics. The time you save by not overreacting can be used to really improve.
I blogged about this last month and have written some other preview posts.
Stop Wasting People's Time (in a #LeanStartup or any Organization) by Separating Signal From Noise
To help illustrate the point, I have a scenario in my talk that's illustrated by a chart that builds, data point by data point. It's a scenario I've been using in workplace talks since my days at Dell Computer in 2000 (when overreacting to individual data points was part of the culture there).
Yesterday, I had the idea to use some GIFs on Twitter to illustrate what the overreaction might look like when a metric improves and when it gets worse. Remember, two data points are not a trend.
Let's say we have a metric and the initial data point is 86. 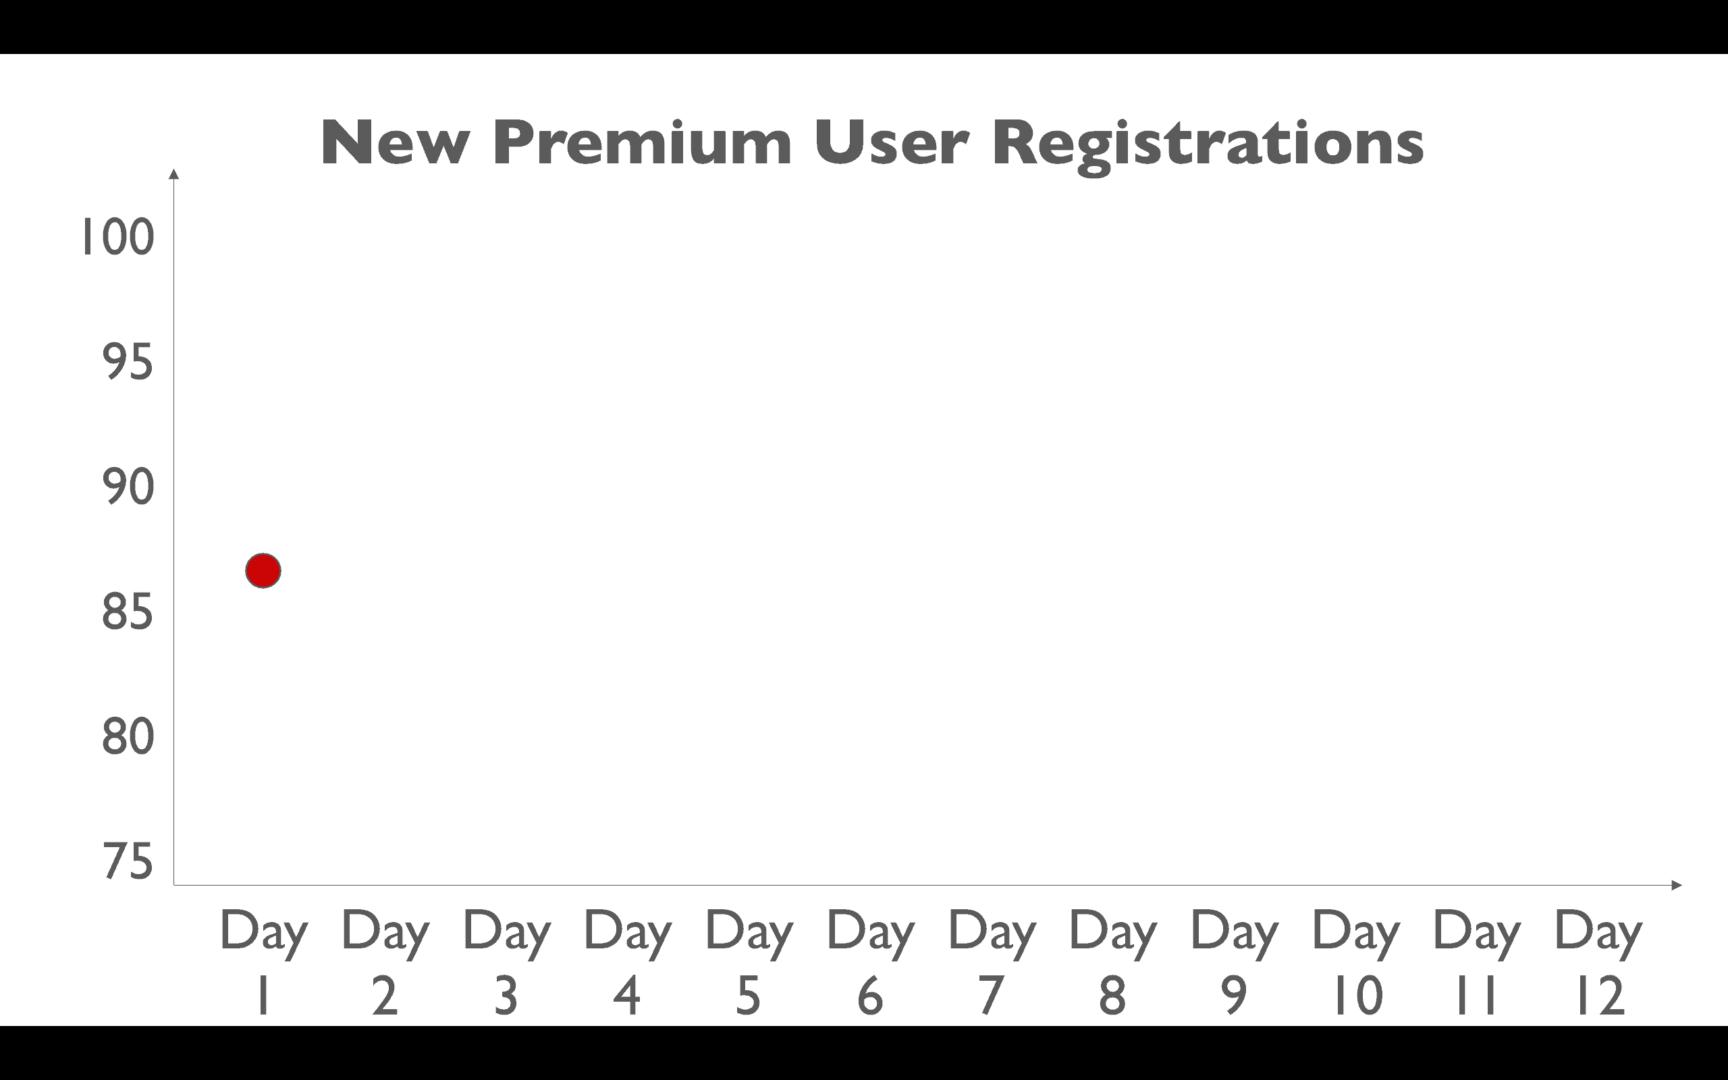
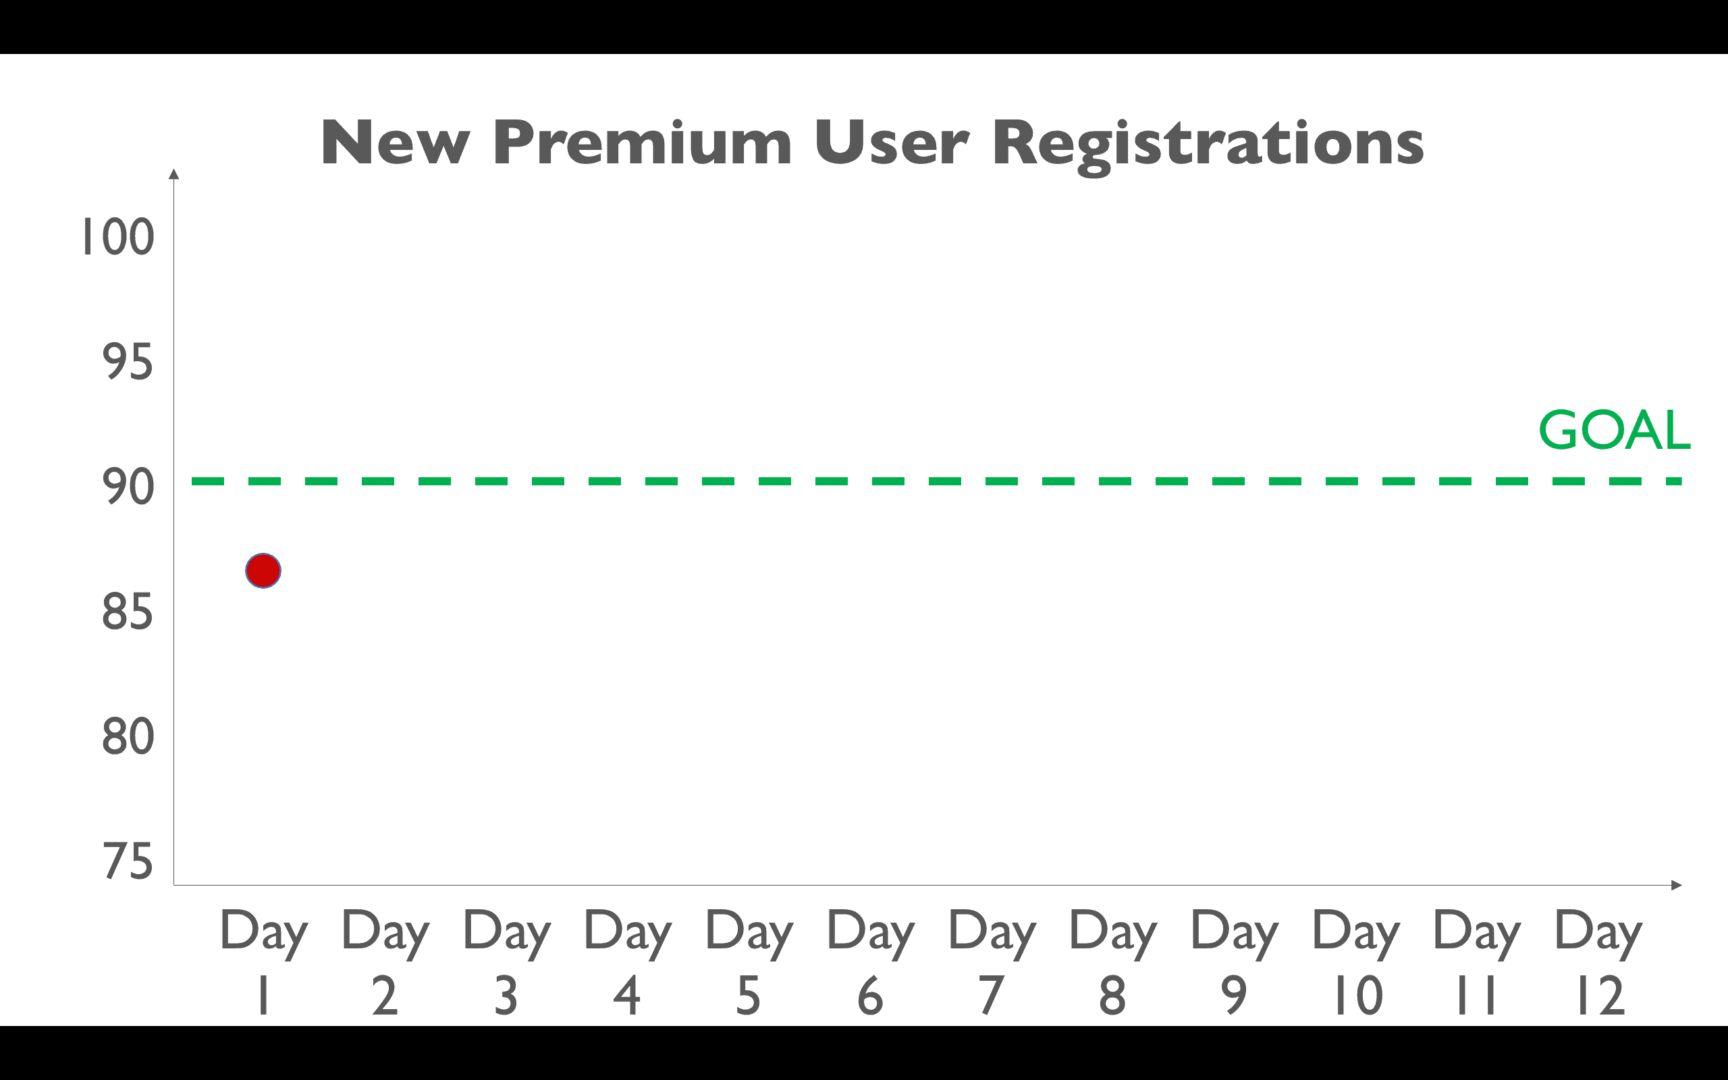
As a leader, you might set a goal at 90 because you want the metric to improve (Dr. Deming would ask, “By what method?” since having a goal is not always enough).
Then, we see the next day's performance — it's higher AND it's above the goal:
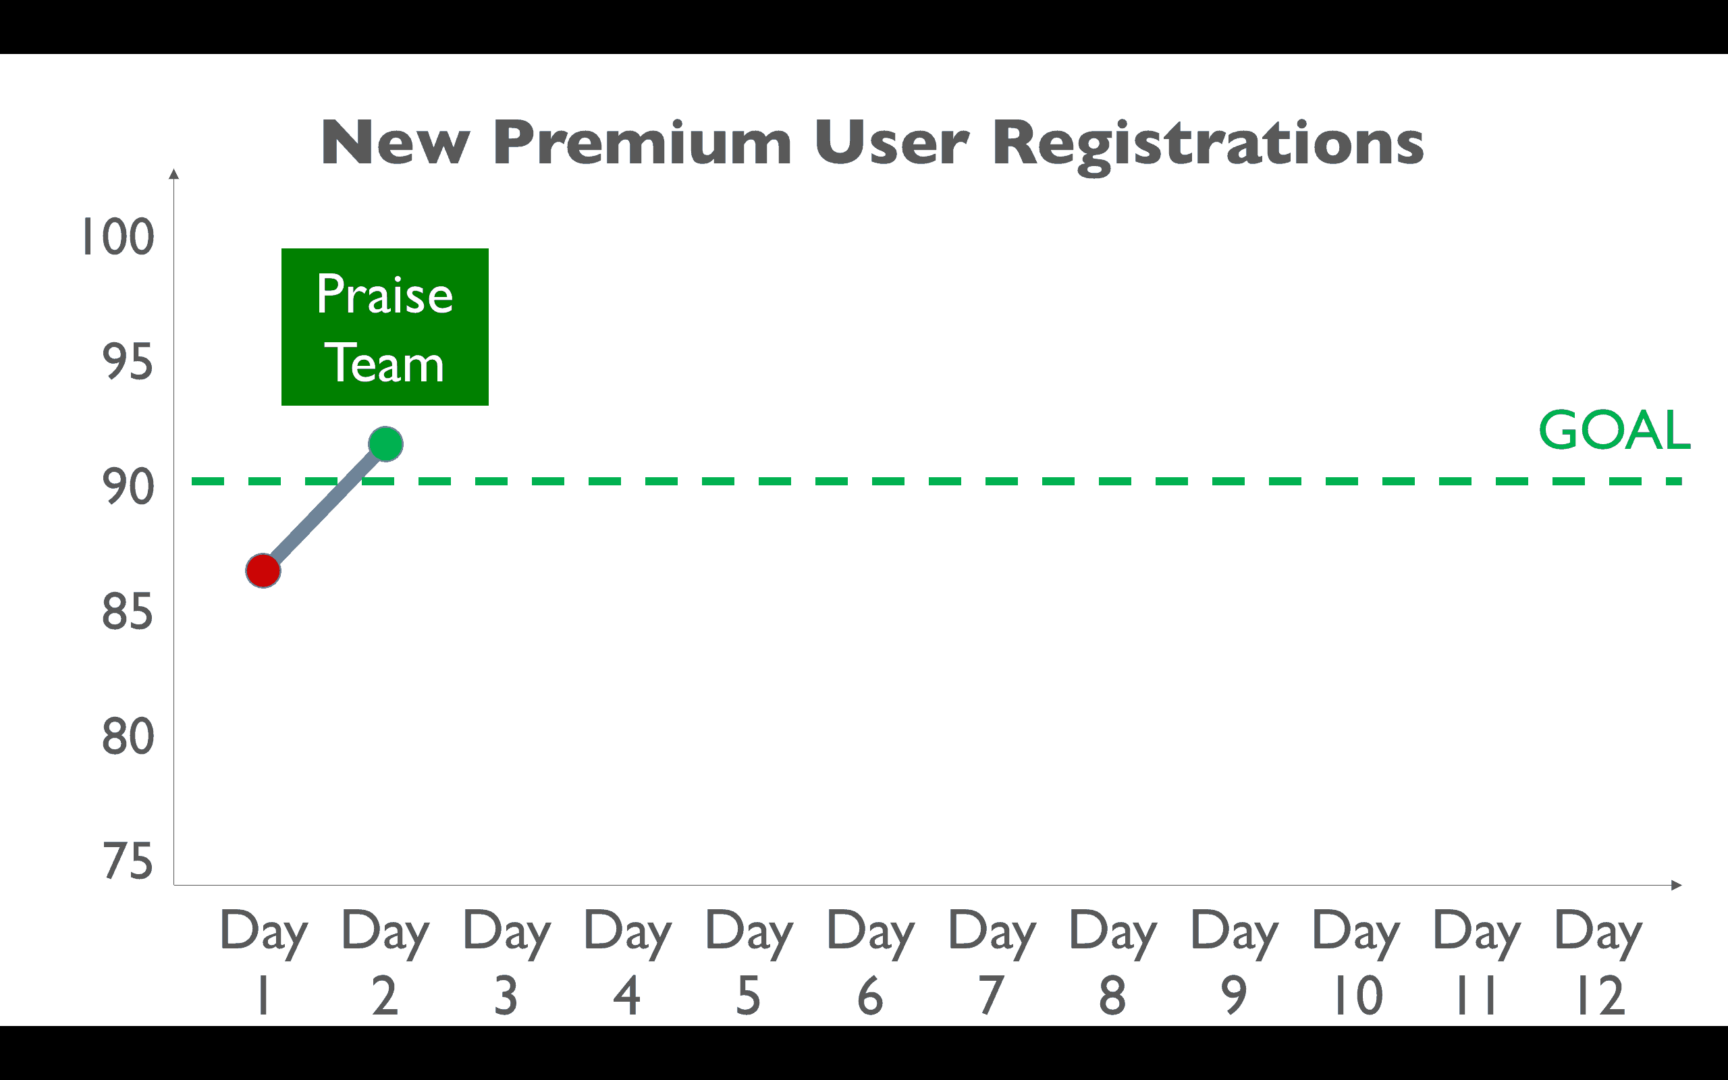
As a leader, you might praise the team for doing better:
And you'll pat yourself on the back for being such an “inspirational leader” — the team just needed a goal, you think. It should have been a “stretch goal,” as that would have been more motivating?
But, then, the next day… performance is worse! And it's below the goal now:
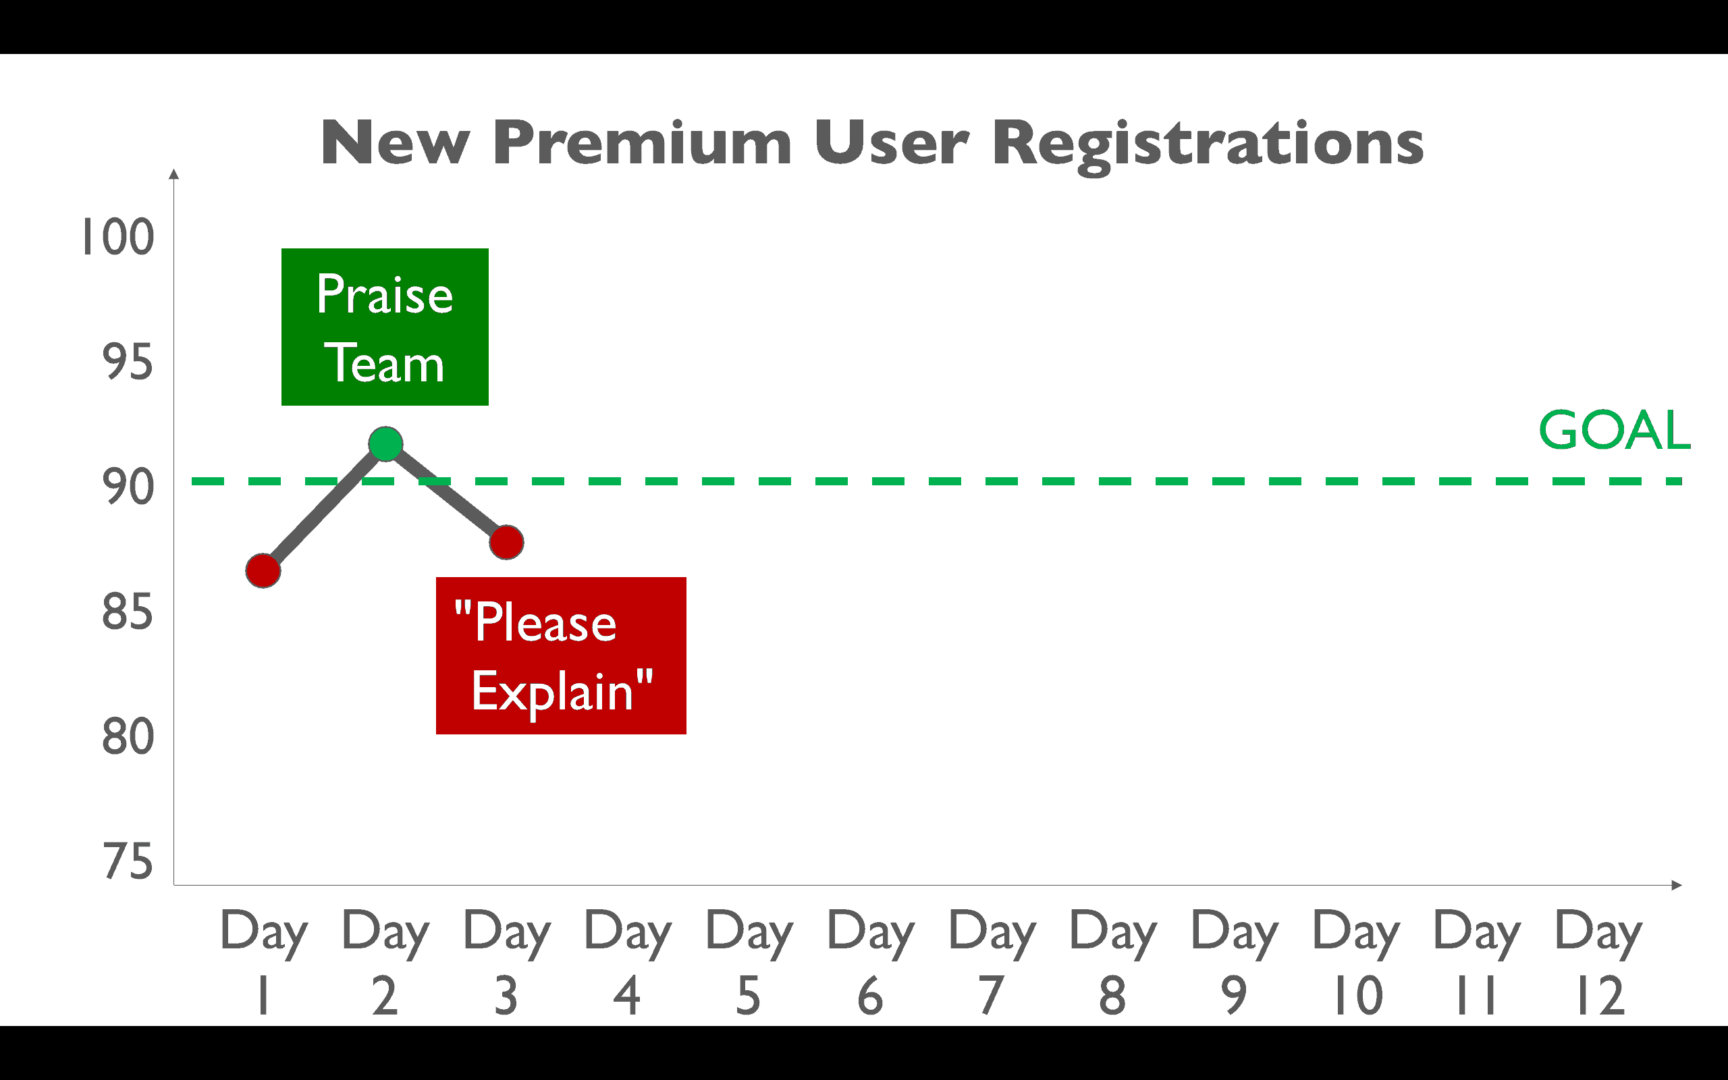
You might react like this:
That tersely-worded email that a leader sends… “please explain” — that doesn't take more than a few seconds to send.
But how many HOURS of discussions, meetings, and investigations take place… looking for a root cause that probably doesn't exist? That's a lot of wasted time. As I've done dry runs of this talk, it seems like this is a very common scenario. “Yes, boss, I'll look into it.”
By the time you've tried cooking up a reasonable-sounding explanation, the next day is here. Performance inevitably gets better:
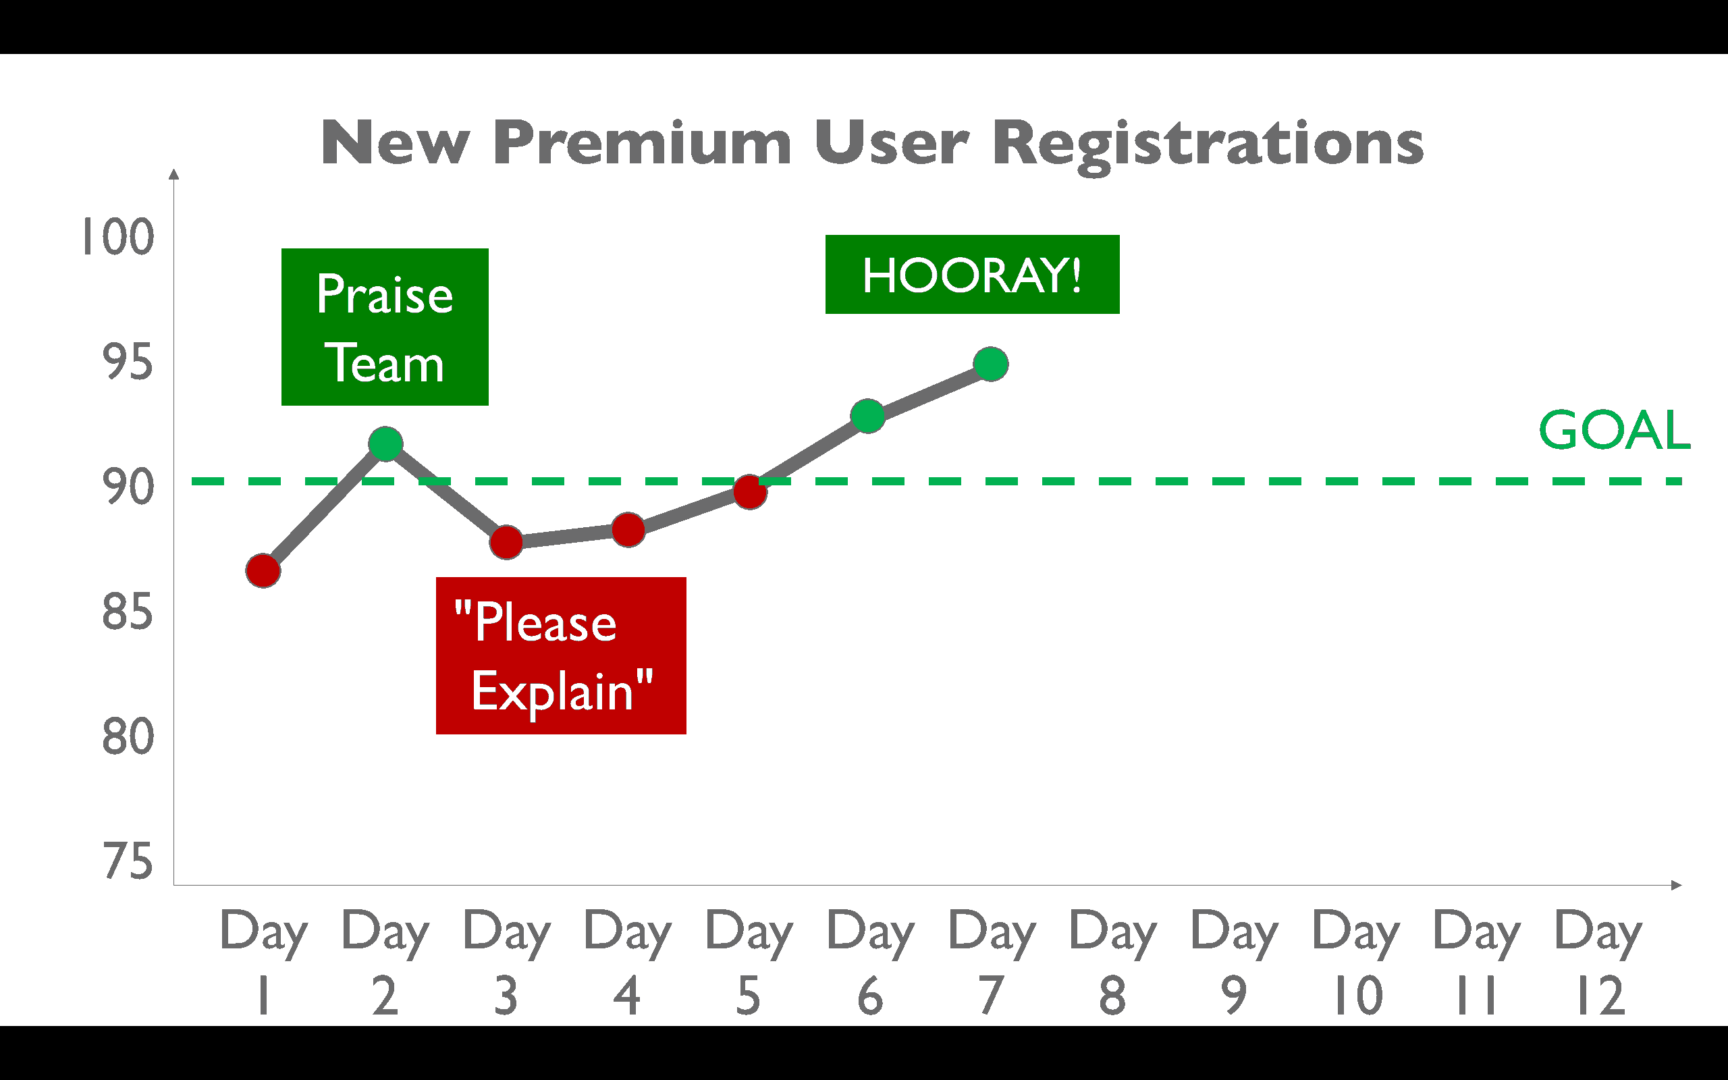
We celebrate again:
But then, performance inevitably drops:
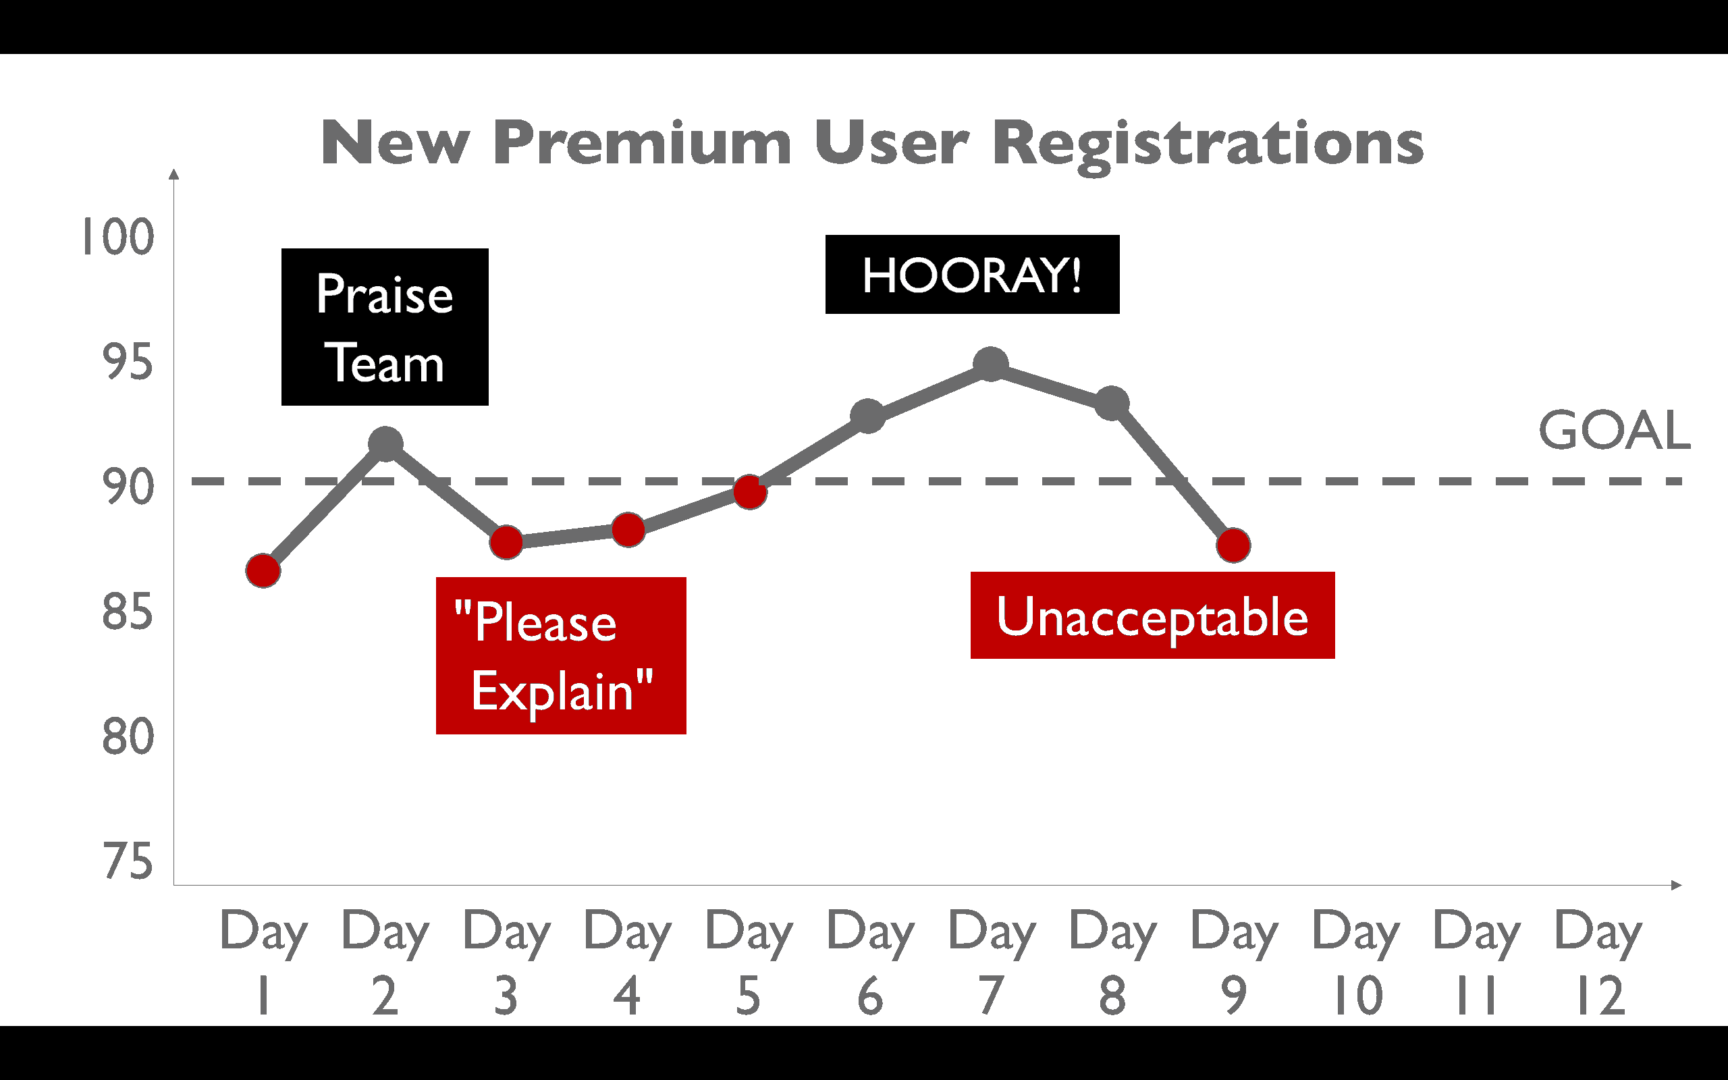
We say that's unacceptable. We tell the team they need to do better. They've shown they can do better in the past… so keep up that level of performance! Why aren't you trying harder?
3) Then the metric gets a bit worse again – #Overreaction #leanstartupweek pic.twitter.com/7g9mMWoaEx
— Mark Graban (@MarkGraban) October 24, 2017
And then performance gets better:
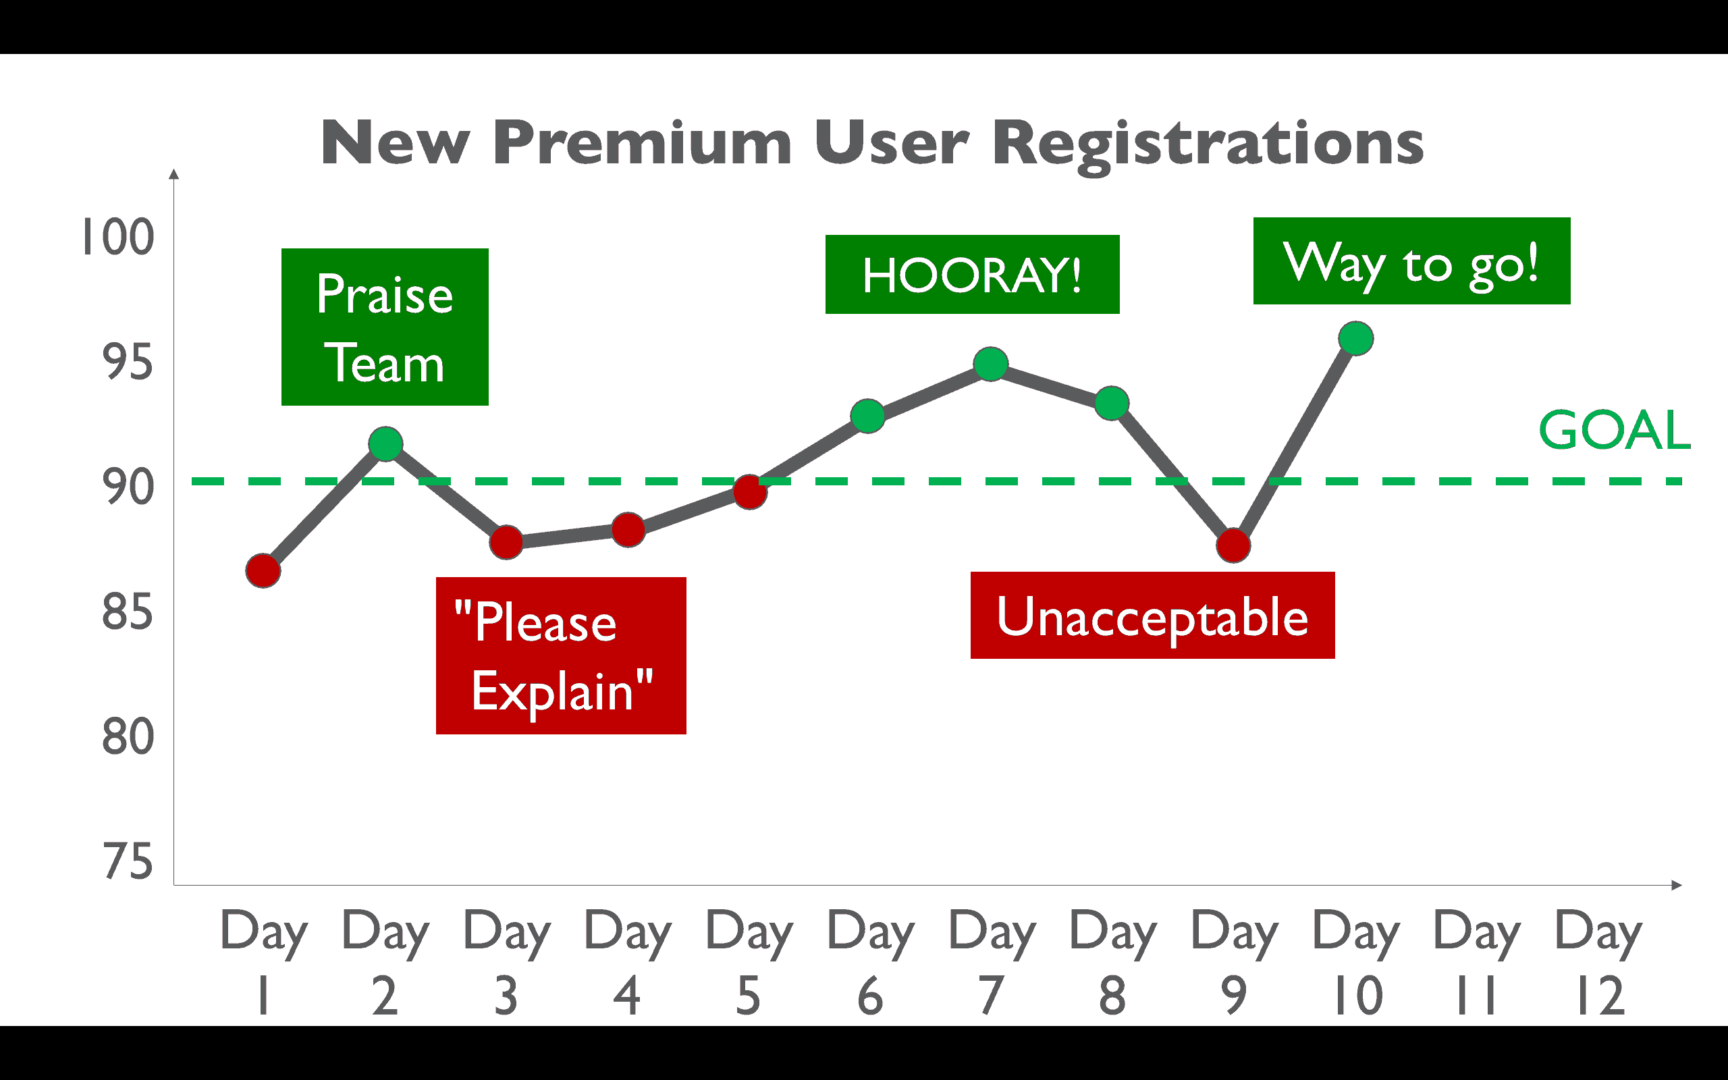
So we celebrate again:
And then performance gets worse:
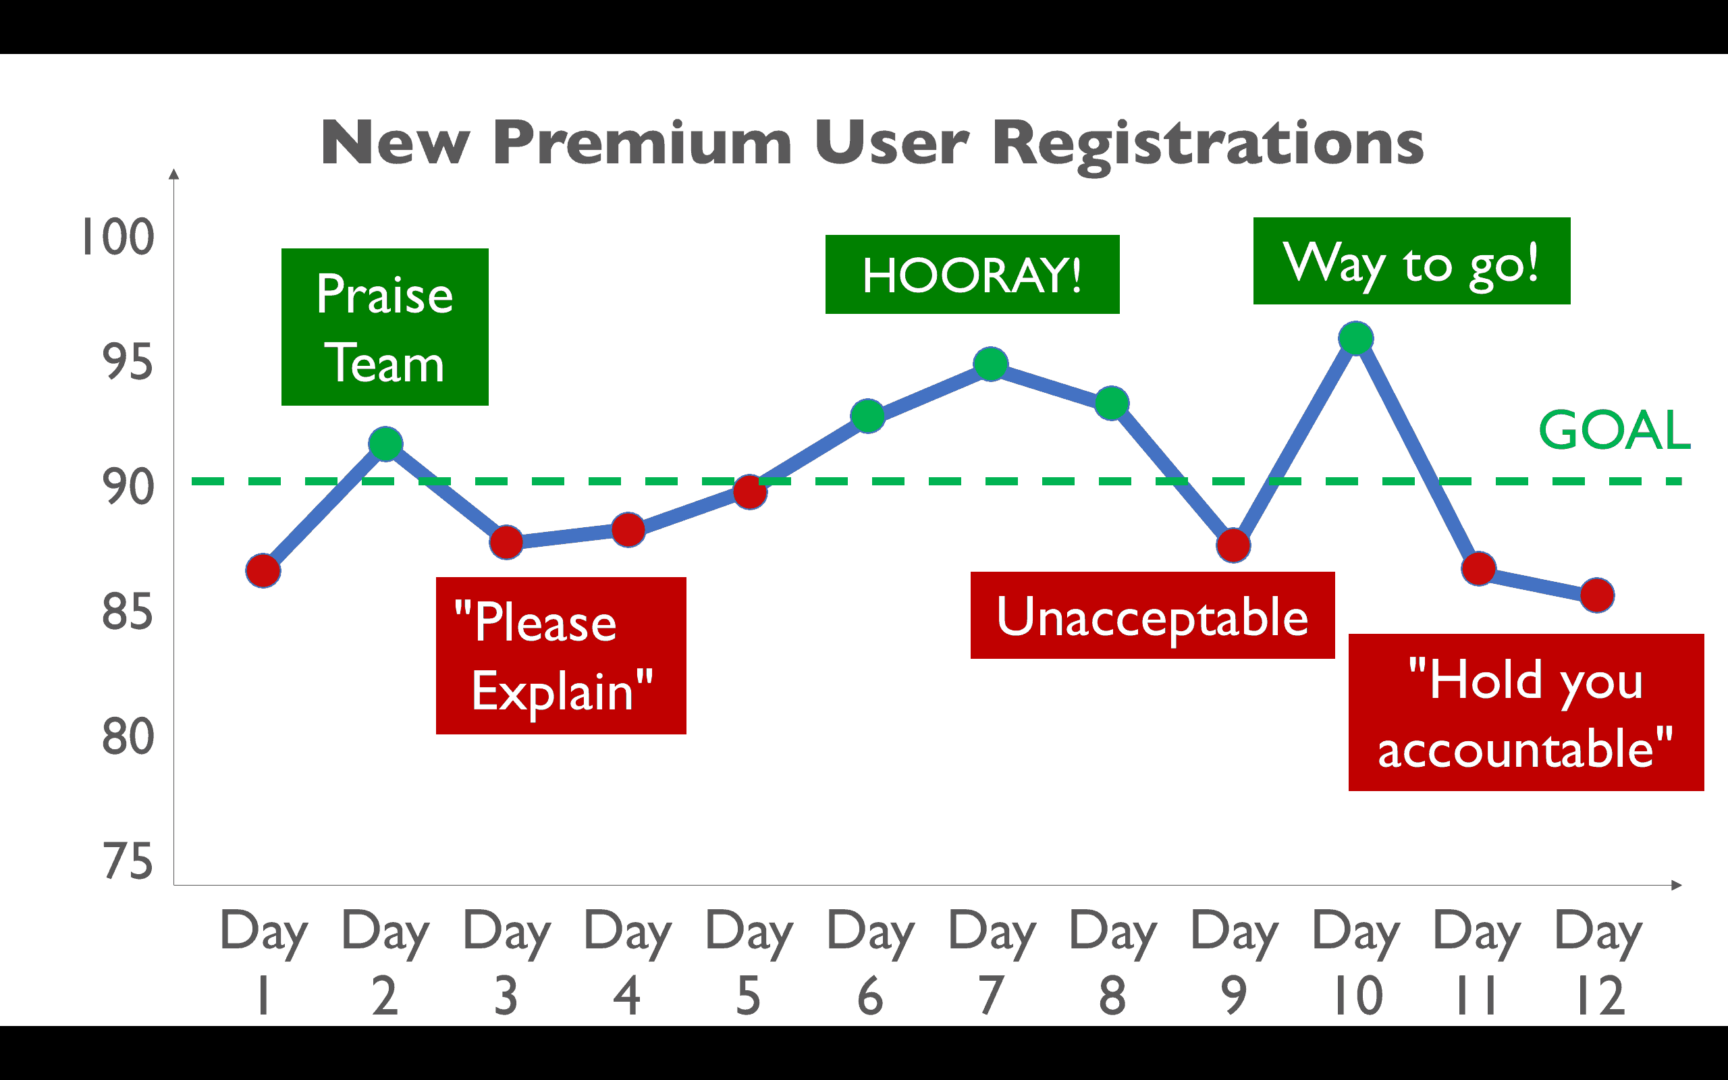
We start throwing around the “accountability” phrase that, too often, means to blame and punish people.
The Punchline
The punchline to the story is that all of the performance in that chart is NOISE in the system. It's what you might call “common cause” variation in a “stable and predictable system.”
The reality that's uncomfortable to some people is that the same people working in the same system in the same market will often produce slightly different results.
There's ALWAYS variation in the output of a system. The question is how much variation is there normally?
Drawing a “process behavior chart” and calculating upper and lower 3-sigma limits shows us that every data point that we were overreacting to (good or bad) is NOISE in a stable system.
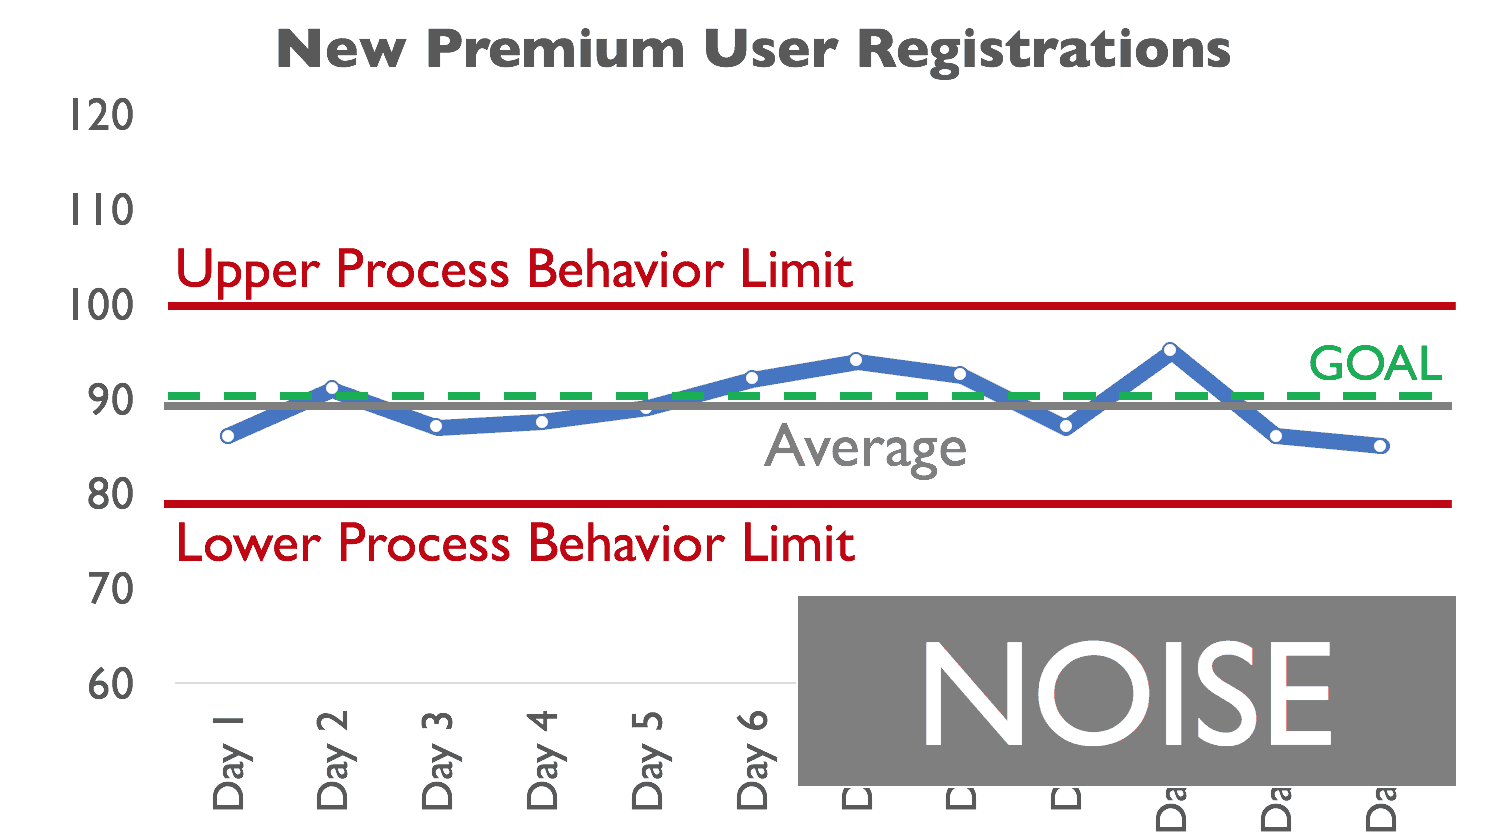
Instead of overreacting and distracting people and asking “what went wrong yesterday?”, our efforts need to be focused on improving the actual system.
When faced with the reality that we were overreacting to noise in the system, you might react like Kramer:
I hope this silly way of illustrating an important lesson is helpful.
What can you do to help your organization stop overreacting to every up and down in your metrics?
What do you think? Please scroll down (or click) to post a comment. Or please share the post with your thoughts on LinkedIn – and follow me or connect with me there.
Did you like this post? Make sure you don't miss a post or podcast — Subscribe to get notified about posts via email daily or weekly.
Check out my latest book, The Mistakes That Make Us: Cultivating a Culture of Learning and Innovation:


